
Apache Ossie + Dosi: A 10-Minute Semantic Layer for Your AI Agent
A 10-minute Apache Ossie + Dosi quick start: install Dosi, query a 191K-row DuckDB dataset from the CLI, connect it to Claude Code over MCP, and ask why revenue dropped.
TL;DR
In ten minutes, Dosi gives us four things:
- Define metrics once. CLI, MCP, REST, and Python all use the same definitions. Switching Agents does not mean teaching the metric layer again.
- Change databases without changing metric definitions. One Apache Ossie YAML model can compile into 16 SQL dialects.
- Every answer has a source. You can inspect the generated SQL and the metric definition, so when something is wrong, you know where to look.
- “Why” is computed by the engine. Attribution is not just an Agent guessing from a few query results, and the decomposition can reconcile back to the total.
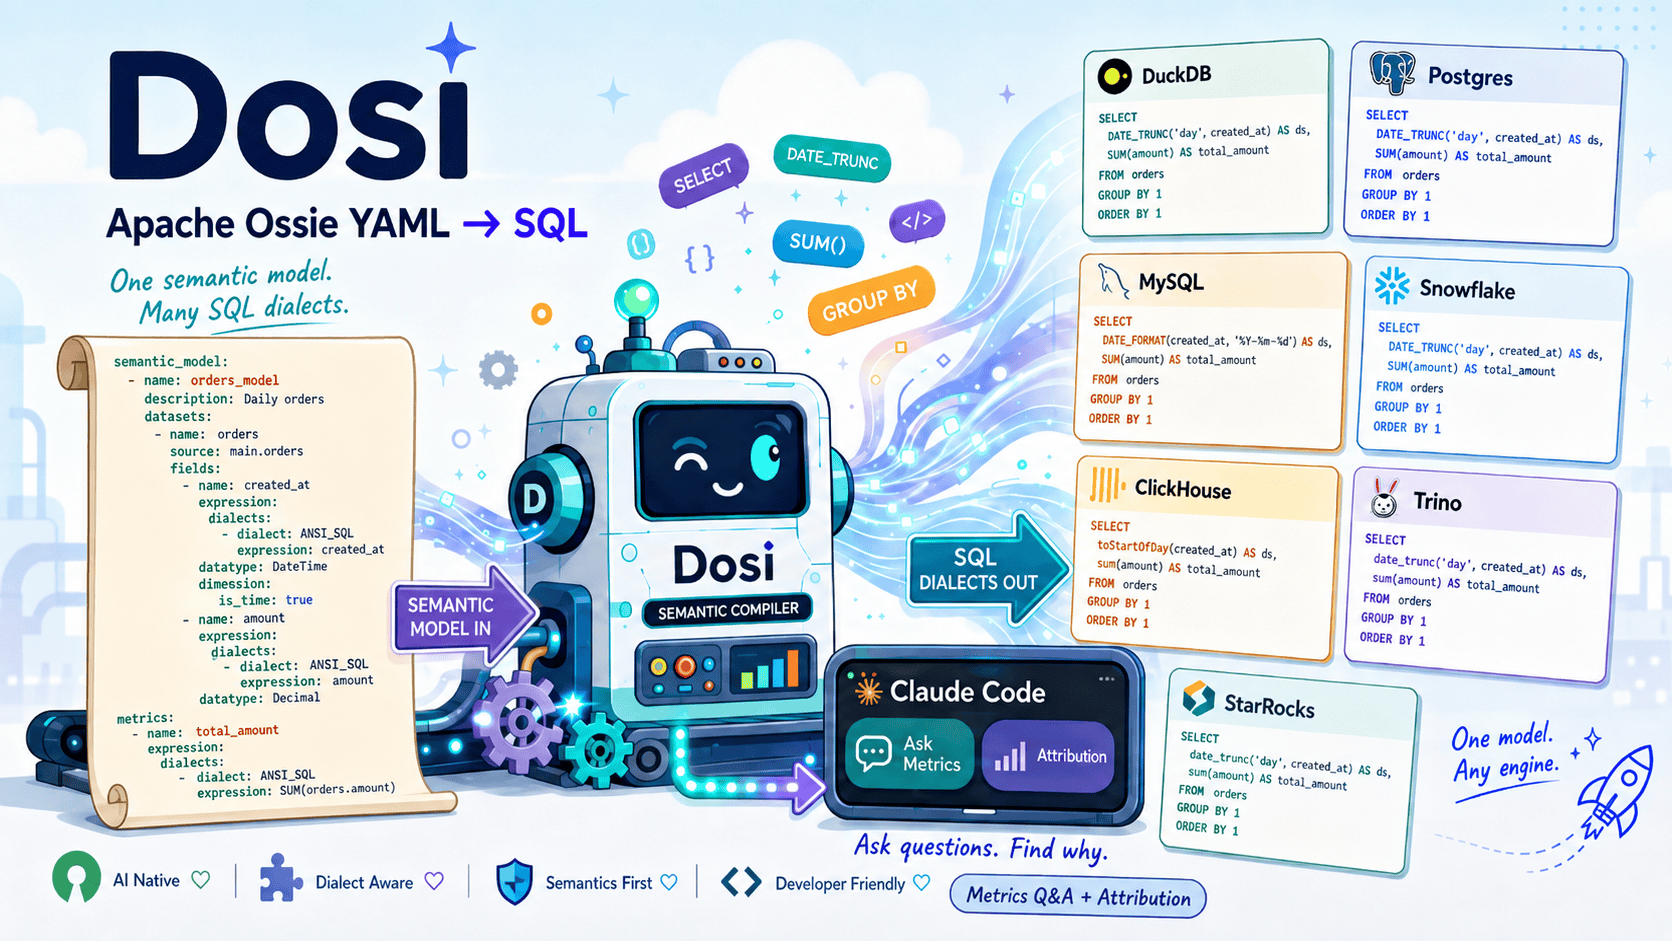
One semantic model. Many SQL dialects.
This is a 10-minute Quick Start for Dosi, a native execution engine for Apache Ossie — the vendor-neutral standard formerly known as OSI (see Open Semantic Interchange, now Apache Ossie), accepted into the Apache Incubator on July 10, 2026. Dosi compiles Apache Ossie YAML semantic models into SQL for 16 database dialects, and exposes the same semantic layer through CLI, MCP, and APIs. Dosi is one implementation of the Apache Ossie / OSI specification, not the standard itself. Compared with letting an Agent generate SQL directly every time, Dosi gives you a more stable and consistent layer for metric definitions, joins, and calculation logic.
We’ll run through the whole flow in ten minutes:
install Dosi → download a 200K-row dataset → query it from the CLI → connect Dosi to Claude Code → ask questions → and finally ask Claude why revenue dropped.
Every command below can be copied directly. This tutorial uses Dosi 0.1.9 and runs entirely on a local DuckDB database, so you don’t need to connect to production.
A version of this article was first published on Medium.
Install Dosi
You need a Linux machine (x86_64 / arm64) or a Mac with Apple Silicon. Installation is one command:
curl -fsSL https://dosi.datus.ai/install.sh | sh
The installer detects your CPU architecture, verifies the SHA-256 checksum, installs dosi and dosi-server into ~/.local/bin, and puts the example Apache Ossie YAML files under ~/.local/share/dosi/examples.
Verify the installation:
export PATH="$HOME/.local/bin:$PATH"
dosi info
dosi       0.1.9
osi spec   0.2.0.dev0
datus-ext  1.5 (accepts 1.0 and up)
mode       datus
build      engine (DuckDB in process)
examples   /home/you/.local/share/dosi/examples
Download a 200K-row dataset
The built-in example only has few orders. That is enough to verify the basic functionality, but not enough to make attribution interesting.
So we’ll use a dataset with around 200K rows:
export DOSI_EXAMPLES=~/.local/share/dosi/examples
export DOSI_DB=$PWD/orders.duckdb

curl -fsSL https://dosi.datus.ai/orders-200k.duckdb -o "$DOSI_DB"
The file is only 2 MB and contains 191K orders, 5,000 customers, and 500 products. Its tables and columns match the built-in orders model, so there is no need to modify the semantic model.
The dataset is generated with hash() rather than random(). It also contains two intentionally planted signals. We won’t reveal them yet — later we’ll let attribution find them.
Query it from the CLI
First, see what metrics are defined in the model:
dosi list metrics --model $DOSI_EXAMPLES/orders/model.yaml
NAME              KIND        DATASETS          DESCRIPTION
revenue           aggregate   orders            Total order amount
order_count       aggregate   orders            Number of orders
unique_customers  aggregate   orders            Distinct purchasing customers
avg_order_value   ratio       orders            Revenue per order (ratio)
total_margin      expression  orders, products  Revenue minus cost (expression over two aggregates)
Pay attention to KIND.
Dosi does not store a metric as just a SQL string. It understands the algebraic type of each metric. Ratios cannot simply be added together, and cross-table expressions cannot always be calculated by joining everything first. The metric type also determines how attribution works later.
Now run a query:
dosi query --model $DOSI_EXAMPLES/orders/model.yaml \
  --metrics revenue,order_count,avg_order_value \
  --group-by customers.region --order -revenue \
  --execute --db "$DOSI_DB"
region  revenue      order_count  avg_order_value
north   5390777.27   52610        102.47
east    5141251.25   50324        102.16
south   4866115.57   47831        101.74
west    4190772.79   40634        103.13
region lives in the customers table, while the metrics come from orders. The join relationship is already defined in the model, so you don’t need to write it in the query.
Remove --execute and Dosi will only compile the SQL without running it. Change --dialect, and the same semantic query becomes SQL for different databases. For example, this query grouped by month:
dosi query --model $DOSI_EXAMPLES/orders/model.yaml \
  --metrics revenue,order_count \
  --group-by orders.order_date:month --dialect mysql
compiles differently per database:
-- duckdb
SELECT DATE_TRUNC('MONTH', orders.order_date) AS order_date__month, ...

-- mysql
SELECT STR_TO_DATE(DATE_FORMAT(orders.order_date, '%Y-%m-01'), '%Y-%m-%d') AS ..., ...

-- oracle
SELECT TRUNC(orders.order_date, 'MM') AS order_date__month, ...
The same concept — “group by month” — has different implementations across databases. Dosi currently supports 16 SQL dialects, so these differences are handled by the compiler instead of being maintained as separate SQL templates.
Connect Dosi to Claude Code
Dosi comes with an MCP Server, so there is no extra adapter to install.
Start it in the background and suppress the logs. This lets us continue using the same terminal, without having to re-export the environment variables:
dosi-server \
  --model $DOSI_EXAMPLES/orders/model.yaml \
  --db "$DOSI_DB" >/dev/null 2>&1 &
Now register the MCP server:
claude mcp add --transport http dosi http://127.0.0.1:8081/mcp
claude mcp list
dosi: http://127.0.0.1:8081/mcp (HTTP) - ✔ Connected
claude mcp list actually connects to the server, so it also works as a simple health check. Dosi exposes a set of tools, ranging from list_metrics to attribute_metric.
Ask questions
Now start Claude Code, then ask:
What are revenue and average order value by region?
Here is a possible output:
| Region | Revenue      | Avg Order Value | Orders |
|--------|--------------|-----------------|--------|
| north  | 5,390,777.27 | 102.47          | 52,610 |
| east   | 5,141,251.25 | 102.16          | 50,324 |
| south  | 4,866,115.57 | 101.74          | 47,831 |
| west   | 4,190,772.79 | 103.13          | 40,634 |

- The revenue difference is mainly driven by order volume, not average order value.
  AOV is almost identical across the four regions, with a range of only about 1.4%.
  Order volume ranges from 40.6K in west to 52.6K in north, a difference of around 29%.

- west has the highest AOV but the lowest revenue. Value per order is not the problem;
  traffic/order volume is.

- Metric definitions: revenue = revenue (sum of order amount);
  avg_order_value = revenue / order count, not value per customer.
  Region comes from customers.region and is joined through orders.customer_id.
The numbers are exactly the same as the CLI results above, because both use the same engine and the same metric definitions.
Claude Code mainly needs to understand that “revenue,” “average order value,” and “region” map to specific Metrics and Dimensions. SQL compilation and execution are handled by Dosi.
The metric definitions in the explanation also come from the semantic model instead of being reinvented by Claude.
So far we have solved the first problem: getting the number right.
But the more common question behind a dashboard is:
Why did it drop?
Without leaving Claude Code, ask:
Revenue dropped significantly in Q2 2024 compared with Q1.
Help me understand why.
This time Claude Code will call Dosi’s attribution tools and then continue drilling down based on the attribution results.
In one actual run, Claude made 11 tool calls in 98 seconds. Here is an excerpt from the result:
This is exactly what the attribution tool is for. Let me load it and compare
Q2 2024 against Q1 2024.
I'll run attribution on revenue, comparing Q1 2024 (baseline) against Q2 2024
(current), across the candidate dimensions.

  Called dosi

Revenue fell $1.57M (−14.8%) Q1→Q2 2024 ($10.58M → $9.01M). The attribution
shows the drop is not broad-based — it's concentrated in three overlapping
signals. Let me confirm whether they're the same story by drilling into the
intersection.

  Called dosi 2 times

The drop has a clear epicenter. Here's what the data says.

Headline

Revenue fell $1.57M (−14.8%), but this wasn't broad-based. The West region
alone accounts for $1.02M — 65% — of the entire company's decline, collapsing
~39% while the other three regions each dipped only 6–8%.

What actually happened in the West

Two compounding problems, both in West:

┌───────────────────┬─────────┬─────────┬────────┐
│       West        │ Q1 2024 │ Q2 2024 │ Change │
├───────────────────┼─────────┼─────────┼────────┤
│ Completed revenue │  $2.39M │  $1.14M │   −52% │
├───────────────────┼─────────┼─────────┼────────┤
│ Completed orders  │  22,503 │  11,617 │   −48% │
├───────────────────┼─────────┼─────────┼────────┤
│ Cancelled orders  │   2,019 │   4,495 │  +123% │
├───────────────────┼─────────┼─────────┼────────┤
│ Cancellation rate │    8.2% │   27.9% │  ~3.4× │
└───────────────────┴─────────┴─────────┴────────┘

- Order volume roughly halved — completed orders dropped from 22.5K to 11.6K.
- Cancellations more than doubled on top of that. Nearly 1 in 3 West orders
  now cancels, vs. 1 in 12 last quarter.

Company-wide this shows up as the top-ranked signal in attribution: completed
revenue −$1.75M, partly masked by cancelled revenue rising +$174K (the tool
flagged these offsetting deltas). Average order value on completed orders
barely moved (~$106 → ~$98), so this is a volume + cancellation problem, not a
pricing one.

The secondary signal: electronics

Electronics fell across every region (−$892K, the largest category drop), but
again worst in the West:

┌─────────────────────┬───────┬───────┬────────┐
│ Electronics revenue │  Q1   │  Q2   │ Change │
├─────────────────────┼───────┼───────┼────────┤
│ West                │ $652K │ $320K │   −51% │
├─────────────────────┼───────┼───────┼────────┤
│ North               │ $702K │ $514K │   −27% │
├─────────────────────┼───────┼───────┼────────┤
│ East                │ $681K │ $487K │   −28% │
├─────────────────────┼───────┼───────┼────────┤
│ South               │ $645K │ $467K │   −28% │
└─────────────────────┴───────┴───────┴────────┘

So there are two distinct stories: a broad ~28% electronics softening
(possibly supply, pricing, or seasonal), plus a West-specific operational
breakdown — volume loss and a cancellation spike — that dominates the total.
Both planted signals were found, separated, and quantified. Claude Code also noticed that the revenue metric includes cancelled orders.
The traditional way to answer this question is to run a long series of exploratory queries: calculate the totals for both periods, compare dimension after dimension, align segments that appear or disappear between periods, and finally calculate how much each segment contributed to the total change.
An Agent can write those SQL queries itself, but the more queries it runs, the easier it becomes for definitions to drift or for the final contributions to stop reconciling with the total.
Dosi turns this part into a semantic-layer primitive.
The attribute_metric call Claude Code just used corresponds directly to this CLI command:
dosi --model $DOSI_EXAMPLES/orders/model.yaml attribute \
  --metric revenue --dimensions customers.region,products.category \
  --baseline 2024-01-01..2024-04-01 --current 2024-04-01..2024-07-01 \
  --db "$DOSI_DB"
It returns structured results directly:
{
  "metric": "revenue",
  "strategy": "term_wise",
  "total_change": {
    "baseline_value": 10579943.81,
    "current_value": 9008973.07,
    "delta": -1570970.74,
    "pct_change": -14.85
  },
  "dimension_ranking": [
    { "dimension": "customers.region",  "score": 0.650 },
    { "dimension": "products.category", "score": 0.568 }
  ],
  "top_dimension_values": [
    {
      "dimension": "customers.region",
      "value": "west",
      "delta": -1020887,
      "contribution_pct": 65.0,
      "drill_down": { "where_sql": "customers.region = 'west'" }
    },
    {
      "dimension": "products.category",
      "value": "electronics",
      "delta": -891722,
      "contribution_pct": 56.8
    }
  ]
}
From one call, we can already see that revenue dropped by 1.57M (-14.8%), west is the most important regional change, and electronics is the most important category change.
Each segment can also return drill_down.where_sql, so the Agent can reuse the filter and continue exploring. The response also contains reconciliation, which checks whether the decomposition reconciles back to the total change.
Ratio metrics use a different attribution method.
For example, average order value dropped from 105.97 to 98.40 (-7.1%). Dosi can decompose that into mix_effect and rate_effect. In this case, mix_effect is only -0.02, while rate_effect is -7.54. Electronics AOV dropped from 97.08 to 70.30, while its share barely changed from 0.277 to 0.278.
Summary
One important design point here is that CLI, API and MCP are not two separate implementations.
The attribute_metric tool you just used from Claude Code and the manual dosi attribute command run through the same semantic engine. The same is true for compile_sql and run_query.
CLI is convenient for humans, debugging, and CI. MCP is convenient for Agents, API is suitable for BI & Services. But there is only one set of metric definitions, one SQL compiler, and one attribution engine underneath all of them.
That is also why attribution belongs in the semantic layer instead of in an Agent prompt.
In ten minutes, Dosi gives us four things:
- Define metrics once. CLI, MCP, REST, and Python all use the same definitions. Switching Agents does not mean teaching the metric layer again.
- Change databases without changing metric definitions. One Apache Ossie YAML model can compile into 16 SQL dialects.
- Every answer has a source. You can inspect the generated SQL and the metric definition, so when something is wrong, you know where to look.
- “Why” is computed by the engine. Attribution is not just an Agent guessing from a few query results, and the decomposition can reconcile back to the total.
Documentation:
If you want know more about how to create semantic model with Agents, try datus.ai, and we have a commercial solution for data teams, see Datus Studio.
Frequently asked questions
Do I need a warehouse to try this?
No. The whole tutorial runs on a local DuckDB database, so you don’t need to connect to production. The dataset is a 2 MB file with 191K orders, 5,000 customers and 500 products, and its tables and columns match the built-in orders model — so there is no semantic model to modify either.
Will my numbers match the ones in this article?
The CLI numbers will: the dataset is generated with hash() rather than random(), so it is deterministic. The agent narrative will not match word for word — in one actual run Claude made 11 tool calls in 98 seconds, and another run may explore in a different order. That is exactly why the deterministic parts belong in the engine and the open-ended exploration belongs in the model.
Why does KIND matter in the metric list?
Because Dosi does not store a metric as just a SQL string — it understands the algebraic type of each metric. Ratios cannot simply be added together, and cross-table expressions cannot always be calculated by joining everything first. The metric type also determines how attribution decomposes the metric: revenue uses term_wise, while a ratio like avg_order_value is split into mix_effect and rate_effect.
How is this different from letting an Agent write SQL against my database?
An Agent can write the exploratory SQL itself, but the more queries it runs, the easier it becomes for definitions to drift or for the final contributions to stop reconciling with the total. Here the join between orders and customers comes from the model, the metric definitions in the explanation come from the semantic model instead of being reinvented, and the CLI and the Agent return identical numbers because they share one engine.
Why is attribution part of the semantic layer rather than the prompt?
Because the CLI, API and MCP are not separate implementations. The attribute_metric tool the Agent calls and the manual dosi attribute command run through the same semantic engine, with one set of metric definitions, one SQL compiler and one attribution engine underneath. The response also contains reconciliation, which checks the decomposition against the total change — something a prompt cannot guarantee.
Do I have to rewrite metric definitions when I change database?
No. One Apache Ossie YAML model compiles into 16 SQL dialects; you change --dialect (or point at another connection) and the model stays as it is. “Group by month” is one concept with different implementations per database, and those differences are handled by the compiler instead of being maintained as separate SQL templates.
Apache Ossie / OSI: official resources
- Apache Ossie project site — the standard’s home under the Apache Software Foundation
- Apache Ossie on GitHub — repository, reference converters, and examples
- Apache Ossie core specification — the semantic model schema
- Apache Incubator status — incubation progress and governance
- “OSI is now Apache Ossie” announcement
Related articles
- What Makes a Semantic Layer Truly AI-Native? — the reasoning behind this tooling
- Dosi MCP Semantic Layer for Agents — No SQL Guessing — semantic MCP versus database MCP
- Introducing Dosi: OSI-Native Semantic Layer for Metrics — surfaces, dialects, and structured errors
- What Is Open Semantic Interchange (OSI)? — the spec Dosi compiles
- MCP for Data Engineering — how MCP fits the wider data stack