
What Is Conversational BI? From Questions to Trusted Metrics
Conversational BI lets people explore data through follow-up questions. Learn how semantic models preserve metrics, filters, and trust across every turn.
TL;DR
- Conversational BI lets you explore business data through questions and follow-ups.
- Reliable answers need shared definitions, clear context, and appropriate access.
- Dosi keeps business definitions reusable across interfaces and supported data sources.
Conversational BI is a way to explore business data through natural-language questions and follow-ups. Instead of building a new report for each question, you ask, review the answer, and keep exploring. A useful system remembers the relevant context and shows enough detail for you to understand what the numbers mean.
“What was revenue last quarter?” is a starting point. “Only Europe” and “Which channels changed most?” turn that answer into a conversation. The value is being able to follow a question where it leads, without losing the meaning of the original analysis.
What conversational BI makes easier
Dashboards answer questions someone has already planned for. Conversational BI helps with the next question: the unexpected dip, the unfamiliar segment, or the comparison that needs a different filter.
A sales manager might start with a quarterly total, compare regions, and then look at a particular customer group. An analyst can use the same interaction to explore a result before deciding which report to build. Answers may appear as numbers, tables, charts, or short explanations.
Natural language makes asking easier. It does not automatically make the answer trustworthy. The system still needs to know whether “revenue” includes refunds, which dates to use, and which information the person asking may see.
This connection between conversation and business definitions is not new. An IBM research paper on conversational BI describes building dialogue around an underlying business model. Today’s language models make the interaction more flexible, but the need for shared meaning remains.
Here, conversational BI means asking questions about business data. It is different from analyzing customer calls or support transcripts, which is also sometimes called conversational analytics.
How it differs from dashboards and agentic analytics
The distinction is about how you work with the data and who chooses the next step.
| Approach | What it does | Who guides the analysis? |
|---|---|---|
| Dashboard | Shows a prepared view of business performance | The report designer and viewer |
| Text-to-SQL | Turns a question into a database query | The person asking the question |
| Conversational BI | Lets you explore through questions and follow-ups | Usually the user |
| Agentic analytics | Plans and carries out steps toward an analytical goal | The agent, within agreed limits |
With conversational BI, you might say, “Show last quarter, then filter to Europe.” With agentic analytics, you might ask, “Investigate why revenue fell,” and let the agent decide which regions or channels to examine.
These approaches can work together. A dashboard gives you the starting view; conversation helps you explore it; an agent can investigate a larger question. All three benefit from using the same business definitions.
What a useful conversation looks like
Consider an illustrative retail example. A team has agreed that net revenue excludes refunds and uses a particular reporting calendar. The conversation should build on those choices rather than reinvent them at every turn.
You begin with “What was net revenue last quarter?” The answer should identify the quarter and use the agreed revenue definition. A total without that context leaves too much room for misunderstanding.
Next, you ask “Only Europe.” The system should keep the same metric and dates while narrowing the region. If “Europe” could mean the customer’s location or the delivery address, it should clarify which one you intend.
Then comes “Break that down by acquisition channel.” The region and quarter should stay in place. The result now answers a more specific question, rather than silently starting a different analysis.
Finally, “Compare it with the previous quarter” adds a comparison. Both periods should use the same definition and regional scope. If one period is incomplete, the answer should explain how the comparison handles that difference.
| Follow-up | What changes | What stays the same |
|---|---|---|
| “Only Europe” | Region | Revenue definition and quarter |
| “By acquisition channel” | Breakdown | Metric, region, and quarter |
| “Previous quarter too” | Comparison period | Definition and regional scope |
Remembering context also means knowing when to let it go. If you now ask for the global total, the Europe filter should disappear. A system that keeps every earlier choice can be just as misleading as one that forgets everything.
Why convincing answers can still be wrong
A fluent explanation and an attractive chart are useful, but neither proves that the analysis is correct. Three problems deserve particular attention.
The meaning changes mid-conversation
The first answer uses net revenue; the next uses gross sales. Or a regional filter disappears when you ask for a channel breakdown. Each answer may look plausible on its own, while the conversation no longer answers your question.
A semantic layer helps by recording shared definitions of metrics, dimensions, and relationships. The conversational application still has to select the right definition and carry your choices into the next question.
The calculation counts the wrong thing
Suppose one order has several refund records. Combining those records carelessly can count the same order more than once. Similarly, adding customer counts from different channels may overstate the total if customers appear in more than one channel.
These are business calculation problems, even when the database accepts the query. The text-to-SQL accuracy problem is therefore about more than producing valid SQL: the result must measure what the user actually asked for.
The explanation says more than the data supports
A channel contributing to a revenue decline does not prove what caused it. Weaker demand, missing data, or a reporting change might produce a similar pattern.
A useful answer separates what the data shows from what still needs investigation. It also says when the source is outdated, a list is incomplete, or access restrictions limit the result. Those details help you decide whether the answer is ready to act on.
What a trustworthy answer should show
You should not need to read SQL to understand a business answer. A response should name the metric, dates, and important filters, then explain any limits that affect interpretation.
For the retail example, “Net revenue in Europe last quarter, grouped by acquisition channel” is much more useful than an unexplained total. A link to the agreed metric definition and a note about data freshness make the answer easier to check and share.
This matters when someone copies a chart into a presentation. The context should travel with the result, so another person can see what was measured. If a correction changes the number, the system should explain whether the change came from a new filter, updated data, or a different interpretation.
Dosi’s approach: shared definitions across tools
Dosi provides the semantic engine underneath a conversational application. Teams define metrics and business relationships in Apache Ossie models, and Dosi turns supported requests into queries for the selected data source. Its official documentation describes access through CLI, MCP, REST, and Python, with support for 16 SQL dialects as of October 2026.
For a business team, the important consequence is reuse: the revenue definition can belong to a shared model rather than being buried inside one dashboard or chat interface. Different applications can work from that model. The conversational application remains responsible for understanding follow-ups, asking clarifying questions, and handling the user’s access.
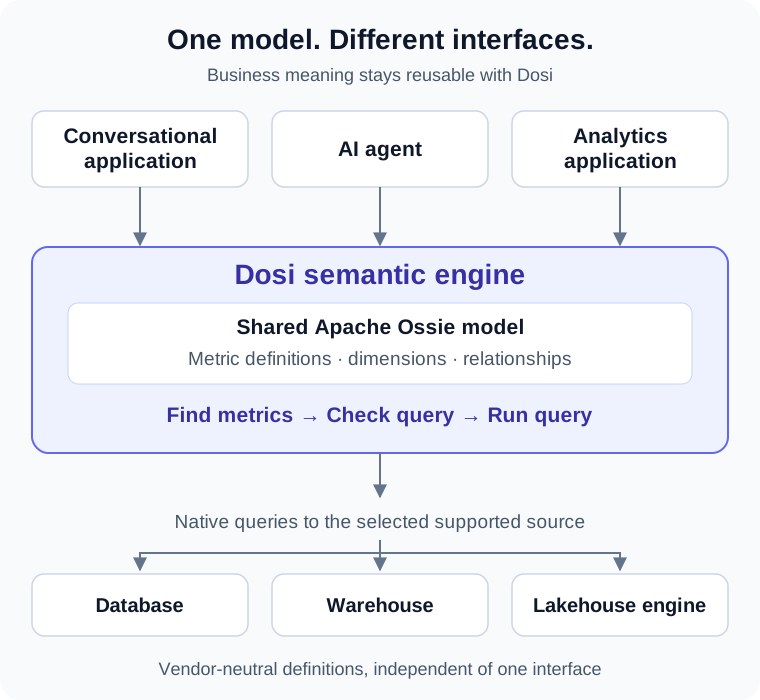
One shared model can serve different interfaces and supported sources. Each request targets a selected source; the applications manage conversation and user access.
Dosi’s agent tools support finding metrics, checking a proposed query, and running it. This gives an application a defined route from a question to a result, rather than requiring it to reconstruct business logic from raw tables each time. The semantic layer in the agent loop explains how those steps support deeper exploration.
Dosi’s distinction is its vendor-neutral approach, built on the open Apache Ossie standard and compatible with open-source agent workflows. It supports multiple data sources without requiring teams to keep their definitions inside one vendor’s existing stack. That does not promise automatic joins across separate warehouses; the data mappings and definitions still need to be checked.
Dosi itself is source-available under Elastic License 2.0, while the Datus agent is open-source. Keeping that distinction clear helps teams evaluate the engine, the agent, and the interface on their own terms.
How to evaluate conversational BI
Start with questions your team already asks and answers an analyst can verify. Test a whole conversation, including follow-ups and corrections, rather than judging a single impressive demo.
Check whether filters carry forward when intended, whether a reset removes them, and whether the system asks when a question is ambiguous. Include a request for information the user should not access. A useful clarification or refusal can be a better outcome than an immediate answer.
Also check what someone else would understand from the result. Are the dates and definitions clear? Is the data fresh enough for the decision? Can the team reproduce the number?
Begin with one business area and an owner for its metric definitions. Expand when the conversations are reliable, rather than assuming that connecting more tables will automatically produce better answers.
Conclusion
Conversational BI makes it easier to follow a business question beyond a prepared report. Its value depends on keeping definitions consistent, carrying the right context forward, and making answers easy to check. Dosi supports that foundation with shared models that can serve different interfaces and supported data sources.
Frequently asked questions
What is conversational business intelligence?
Conversational business intelligence lets people explore business data through natural-language questions and follow-ups. Answers can include numbers, tables, charts, and explanations. A useful system keeps relevant context so you can refine an analysis without rebuilding a report.
Is conversational BI the same as text-to-SQL?
No. Text-to-SQL turns a question into a database query. Conversational BI also manages follow-ups, clarifies meaning, and presents the result. It may use text-to-SQL or a semantic engine to answer the question.
Does conversational BI replace dashboards?
Usually they serve different needs. Dashboards work well for recurring reports, while conversation helps with questions beyond the prepared view. Both should use the same metric definitions so the numbers remain comparable.
Why does conversational BI need a semantic layer?
A semantic layer records agreed definitions such as how revenue is calculated or what counts as an active customer. This reduces the need to guess business meaning for every question. The application still needs to interpret your request correctly, and the definitions themselves need review.
Can conversational BI work across multiple data sources?
Yes, if the application supports those sources and their definitions are aligned. Supporting several sources does not necessarily mean joining them in one query. Check that dates, calculations, and data freshness are comparable before combining results.
Related articles
- What is agentic analytics? — when an agent chooses the next analytical step
- What is a semantic layer? — shared business definitions
- Why text-to-SQL fails without a semantic layer — why valid queries can give misleading answers
- The semantic layer in the agent loop — how Dosi supports deeper exploration
- Datus glossary — the short definition and related concepts