
Datus September Update: The Semantic Layer in the Agent Loop
Datus's September 2026 update: putting the semantic layer in the agent loop as a deterministic checker, plus Datus Agent 0.4.2 and Dosi 0.1.12 release notes.
TL;DR
- Today’s models write SQL well and can call metrics over MCP, yet a data agent still can’t be trusted to run a full analysis on its own — because every step running is not the same as the whole chain being correct.
- This month’s throughline: move the semantic layer from “defining metrics” to actually living inside the agent’s analysis loop, where it acts as a deterministic checker for grain, fanout, and ambiguity.
- Three bets we’ve grown more confident in: the semantic layer becomes the agent’s rule checker; ontology gives the agent a bounded business world to explore; and metrics keep getting more composable.
- The releases: Datus Agent 0.4.1 and 0.4.2 (end-to-end metric analysis,
read_imagemultimodal input, model-call tracing, more database adapters and plugins) and Dosi 0.1.9 → 0.1.12 (Detail Query, derived/composed metrics, grain alignment, metric lineage). - Put together, Dosi’s query paths now cover Metric, Dimension, Attribution, and Detail over one shared model — a direction we call Dosi Select.
We’ve been heads-down on Dosi's semantic layer and ontology lately, and one question keeps coming back to me: today’s models are already great at writing SQL, and metrics are a tool call away over MCP — so why is it still hard to trust a data agent to run a full analysis on its own?
The problem, more and more, isn’t the SQL. Ask “why did revenue drop this month?” and an agent will happily look at Region, then Product and Channel, drill into Customer and Order, and even pull up Support Tickets. Models can absolutely run a dozen steps like that. But every step running is not the same as the whole chain being correct. Can revenue actually be split by this dimension? Are the two metrics at the same grain? Will this join fan out? Does “Region” mean the customer’s, the store’s, or the delivery address? Get one of those wrong and the final answer still looks reasonable — the number is just quietly off.
There’s a lot in this month’s Datus and Dosi releases, but the throughline is simple: move the semantic layer from “defining metrics” to actually living inside the agent’s analysis loop. Before the release notes, here are the three bets we’ve grown more confident in.
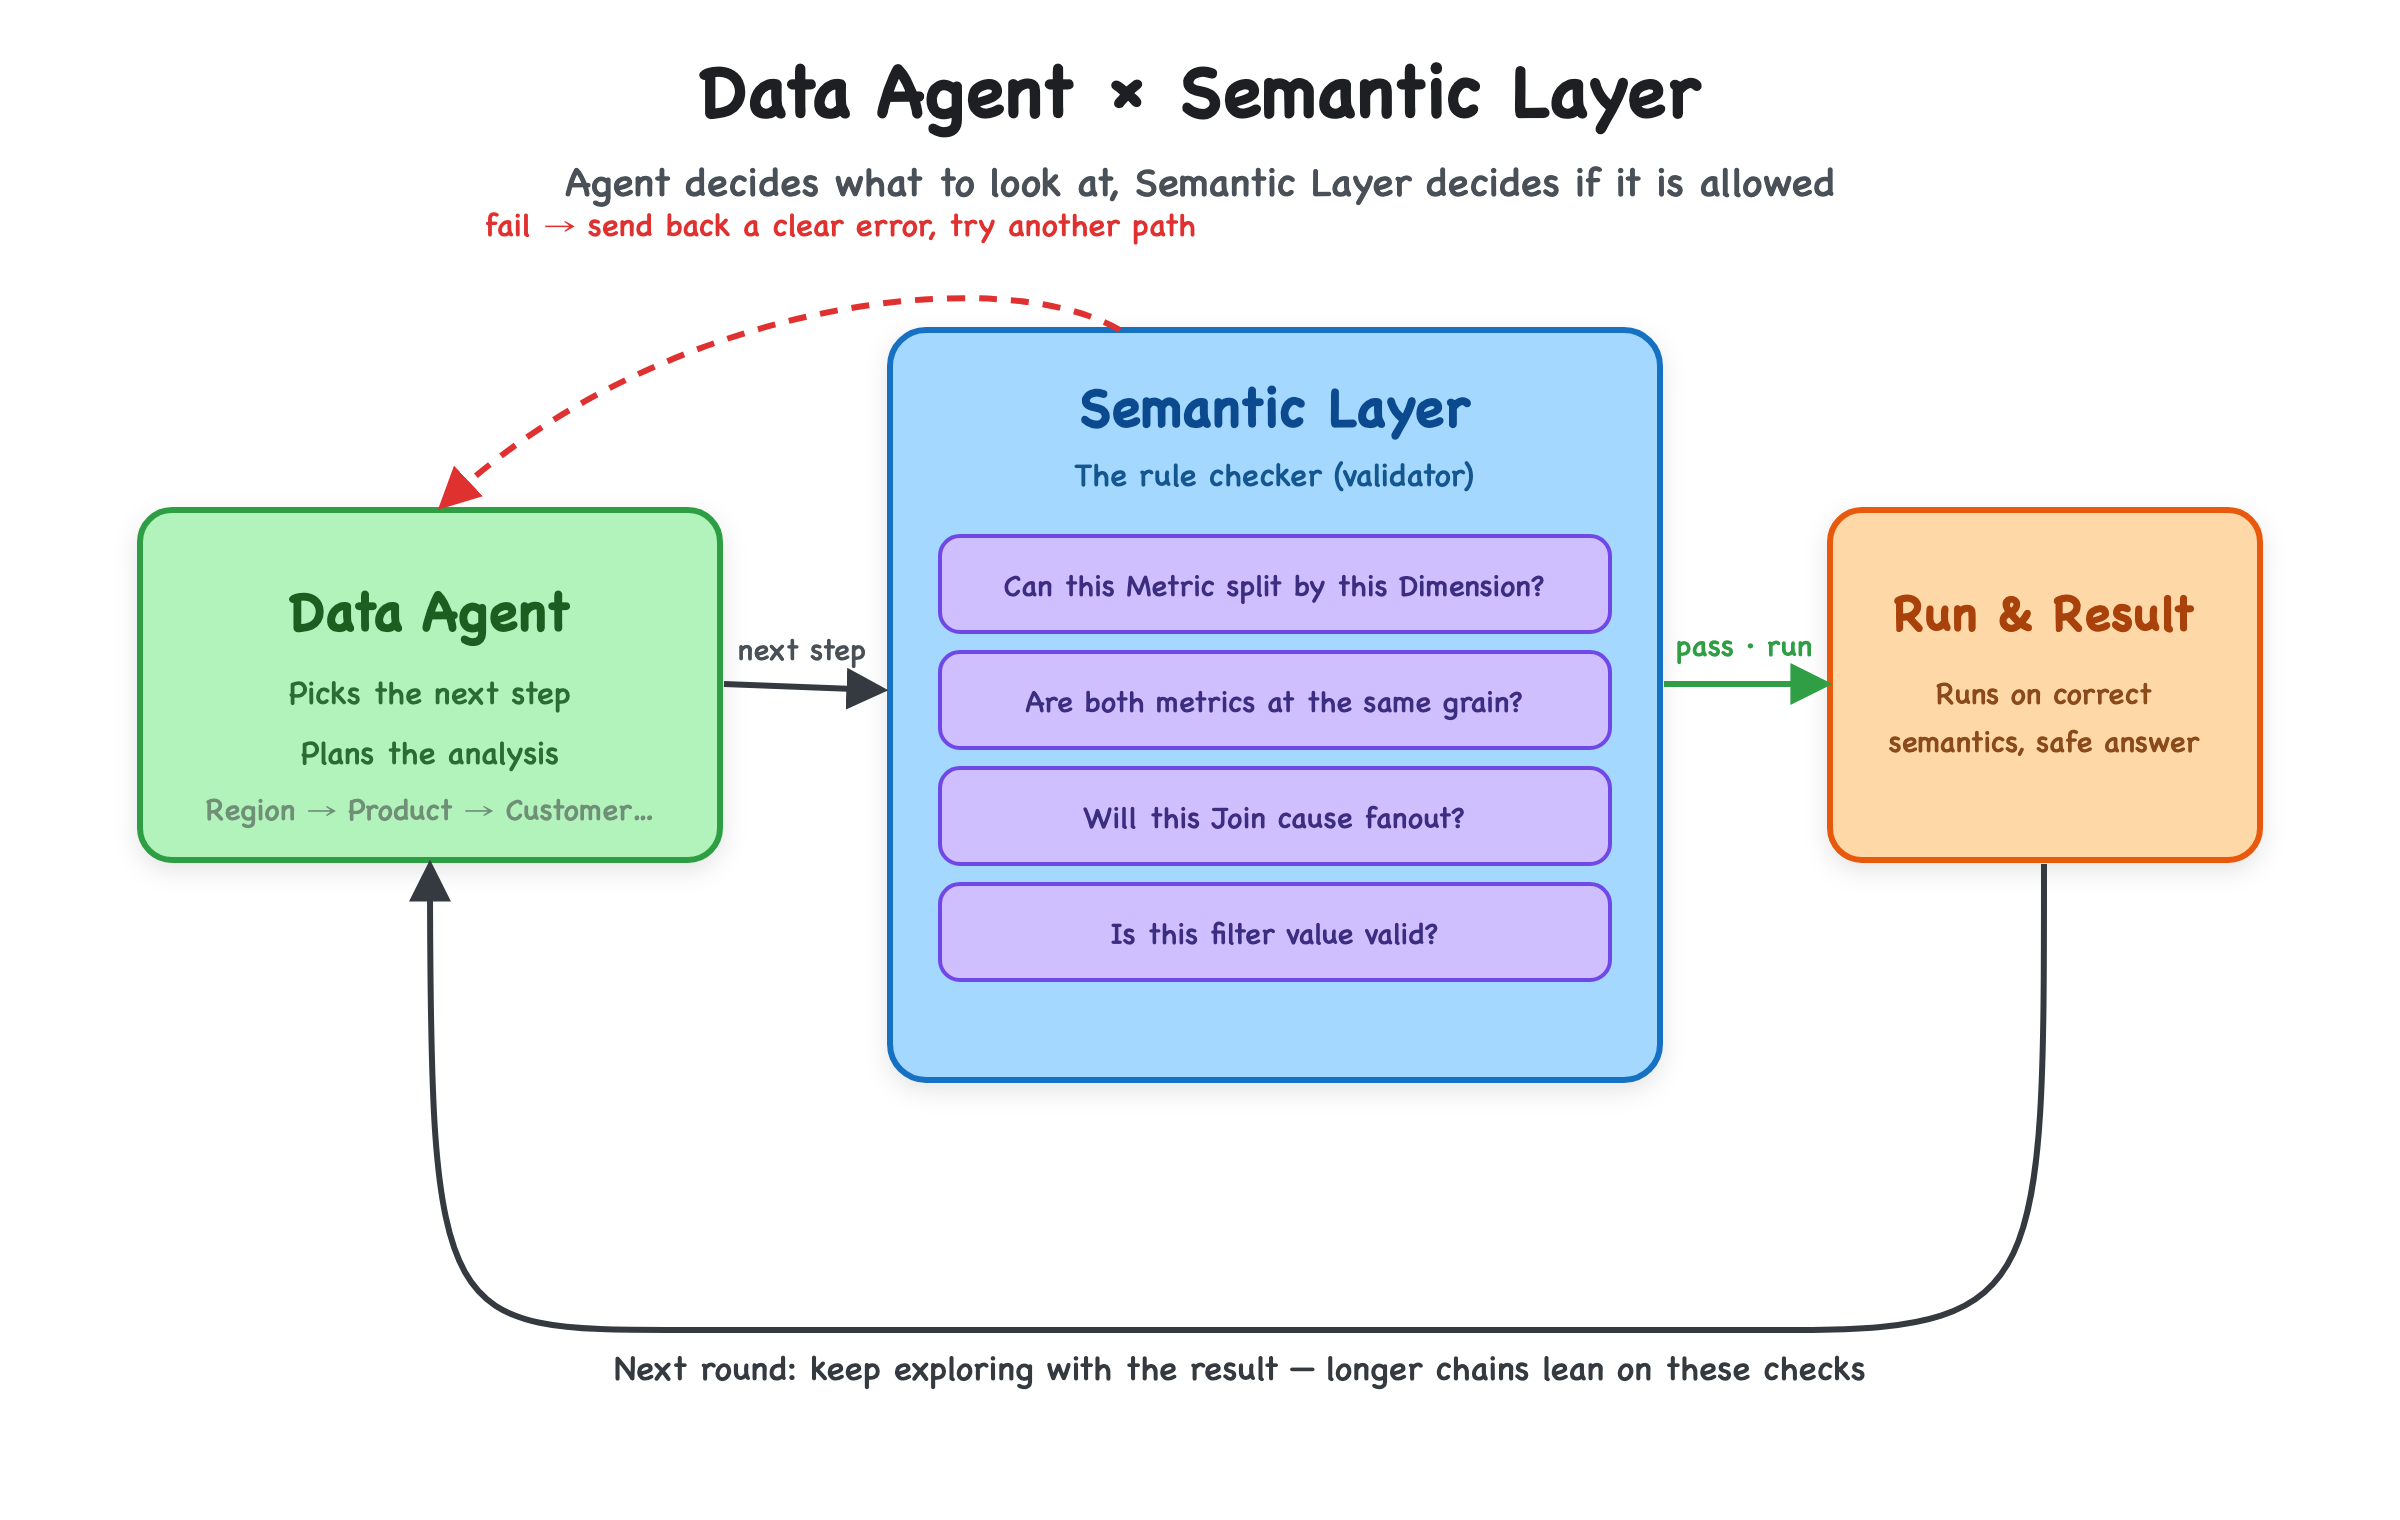
The Agent explores freely; the Semantic Layer decides what’s allowed. Together they form one loop.
1. The Semantic Layer Steps Into the Agent Loop
A traditional semantic layer mostly answers one thing: metric definitions — how Revenue, GMV, or Active Users are computed. That was already valuable in the BI era, since a metric no longer had to be re-implemented across dozens of dashboards and hundreds of SQL files.
But an agent’s work goes further. Getting Revenue is just step one; after that come filters, drill-downs, comparisons, attribution, detail queries, even hopping across semantic models to find business objects and rows. If all of that falls back to the model free-writing SQL, the semantic layer’s value runs out fast.
So what we’ve been building into Dosi is a shift from “define and query metrics” to constraining what’s allowed to happen in a full analysis. Which dimensions a metric supports, whether the current grain can still aggregate, how two datasets relate, whether a join will inflate the data — the system can decide all of this directly. The agent still chooses what to look at next; the deterministic part is handed to the semantic layer. We used to argue about the accuracy of a single query. Inside an agent, what matters more is whether a whole chain of steps stays correct — and the longer the chain, the more that shows.
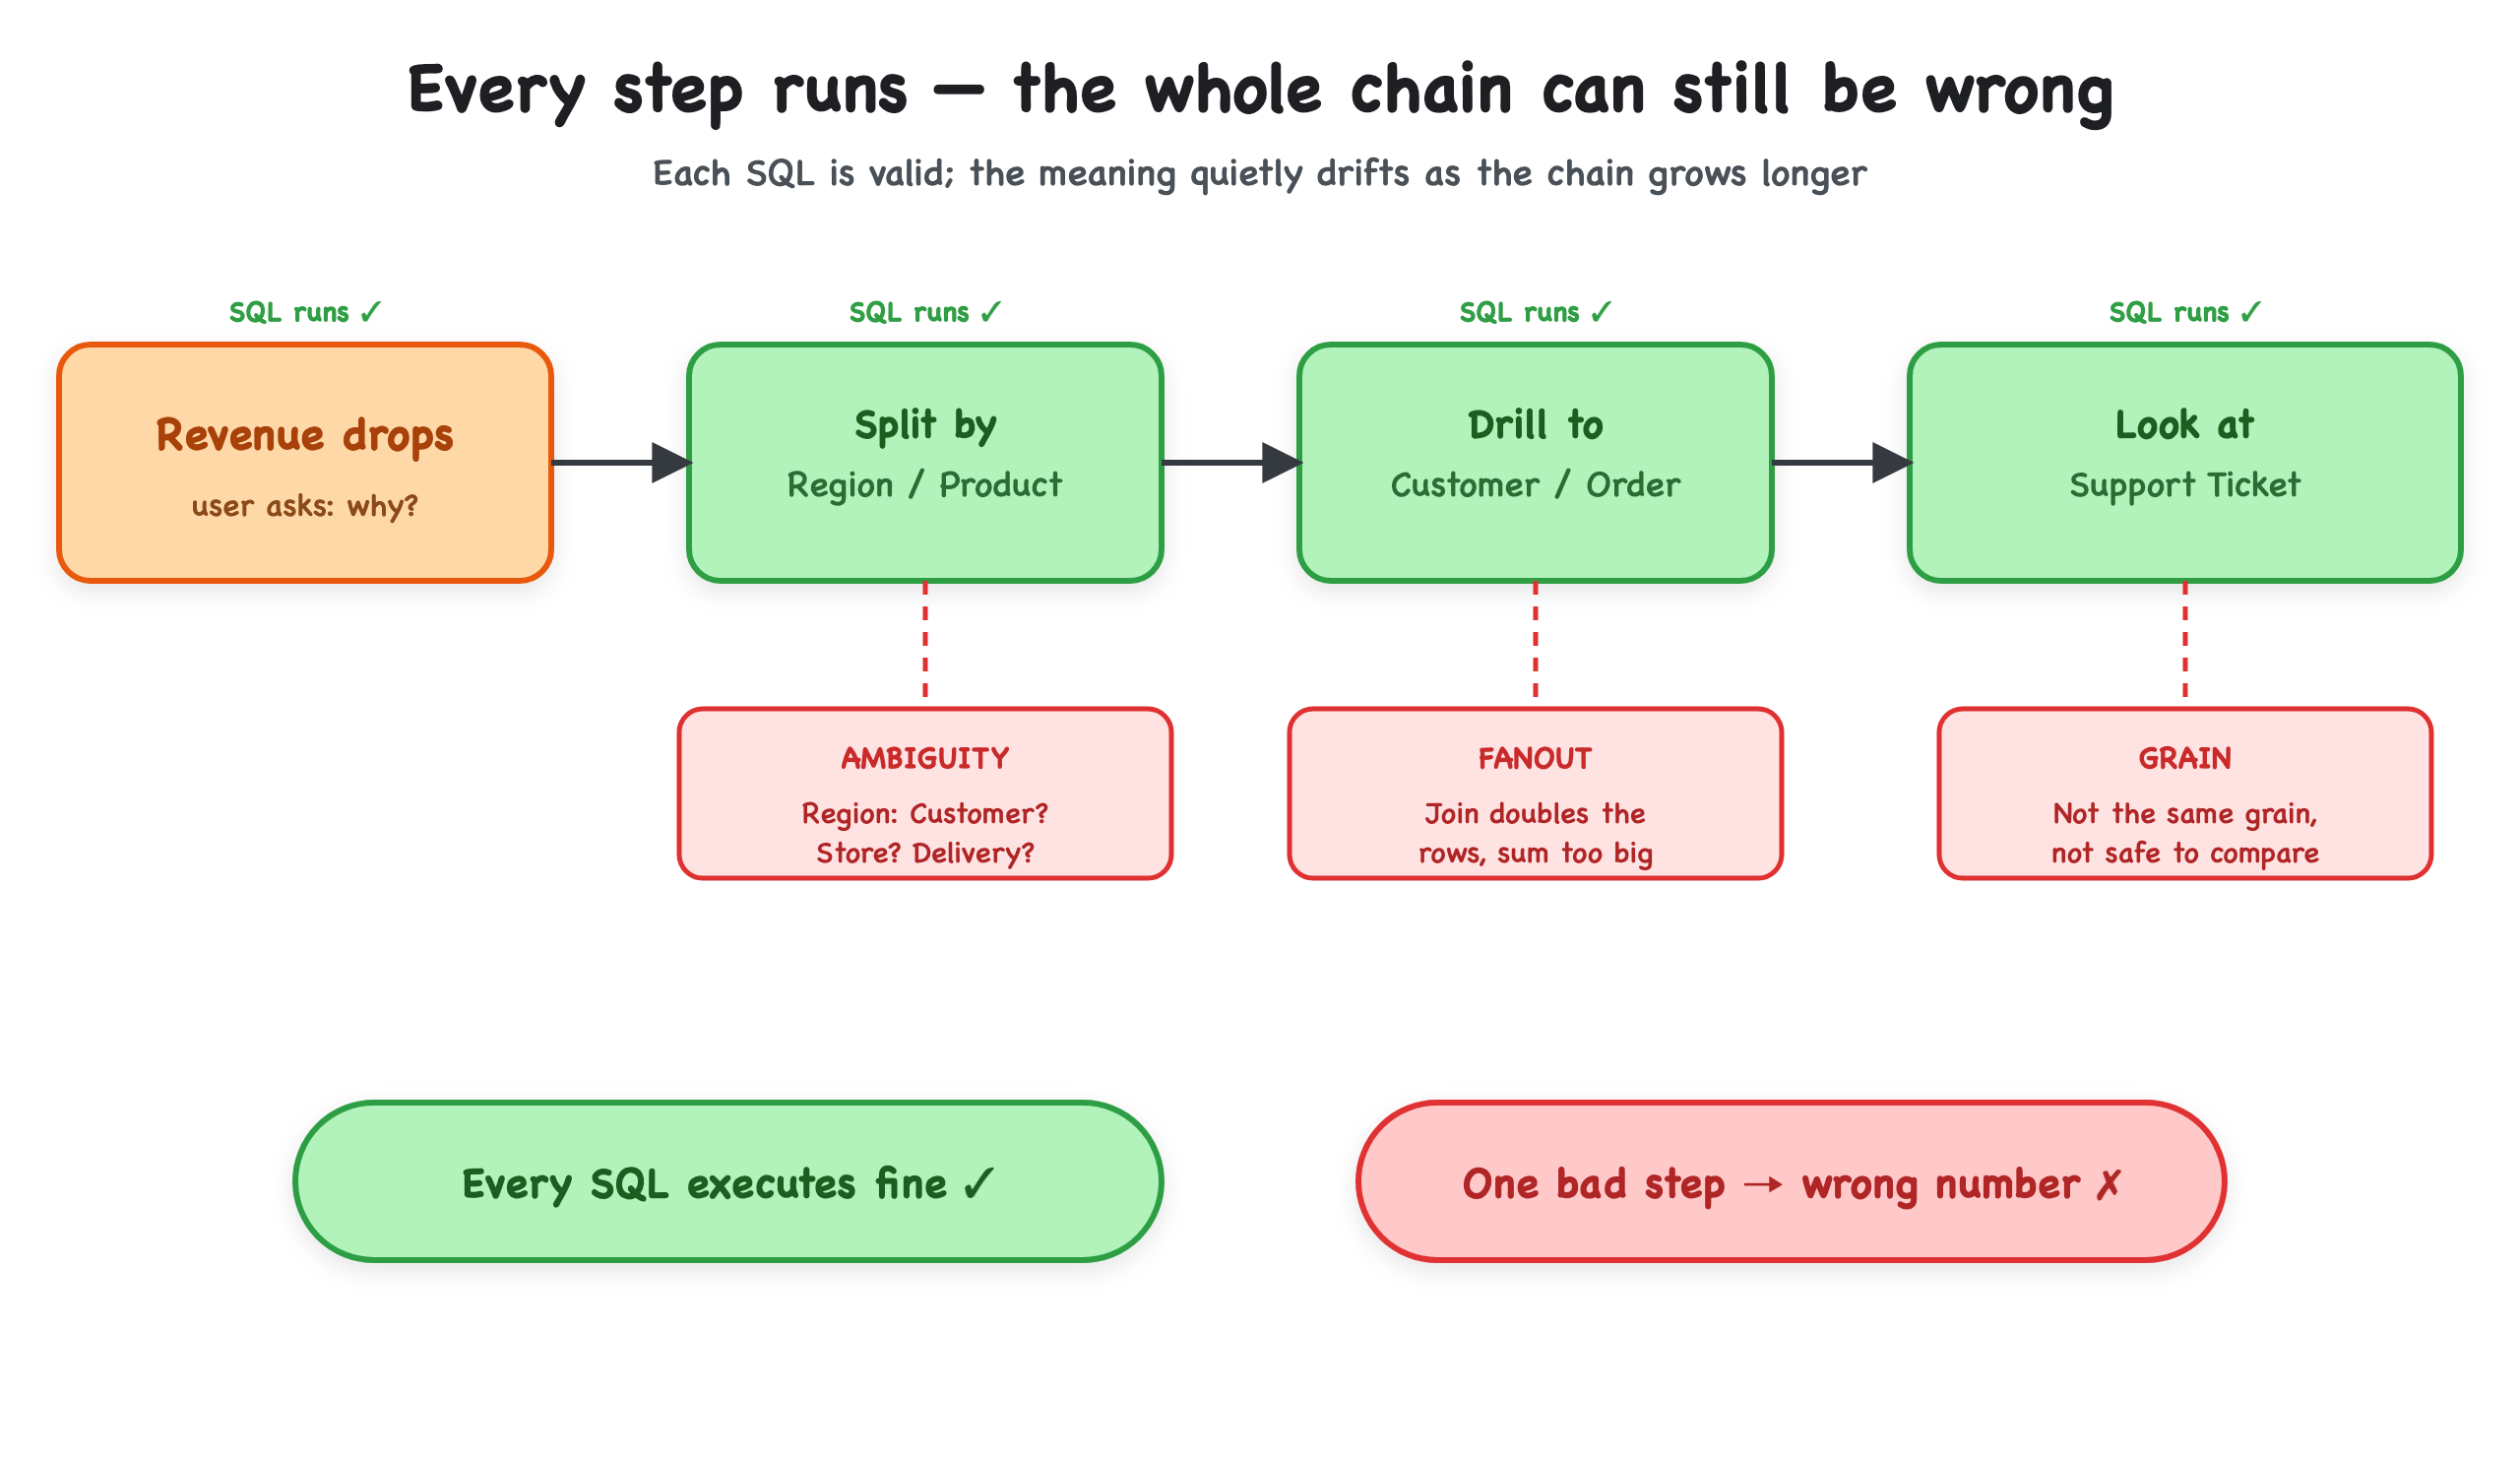
Each SQL is valid; the meaning quietly drifts as the chain grows longer.
2. Ontology Gives the Agent a Bounded Business World
Ontology is starting to play a more concrete role here. I now think of it as the business space an agent is allowed to explore. Revenue belongs to an Order, an Order links to a Customer, a Customer may have an Account Owner and may have opened Support Tickets — those objects, relationships, and value domains form a bounded world.
So when a user asks “which customers drove the revenue drop, and did they have recent service issues?”, the agent can follow relationships that are already defined instead of re-searching thousands of warehouse tables every time. Enterprise data is also full of ambiguous fields — a single order can carry a Customer Region, a Store Region, and a Delivery Region. Ontology pins down what each concept means and how they connect, so the agent knows when it can keep going and when it needs to check back with the user.
That’s probably ontology’s most practical value for a data agent: shrink the search space, provide certain business paths, and stitch different semantic models together. A knowledge graph is just one way to express it. (If you’re weighing how this sits next to the metric-oriented view, see semantic layer vs ontology.)
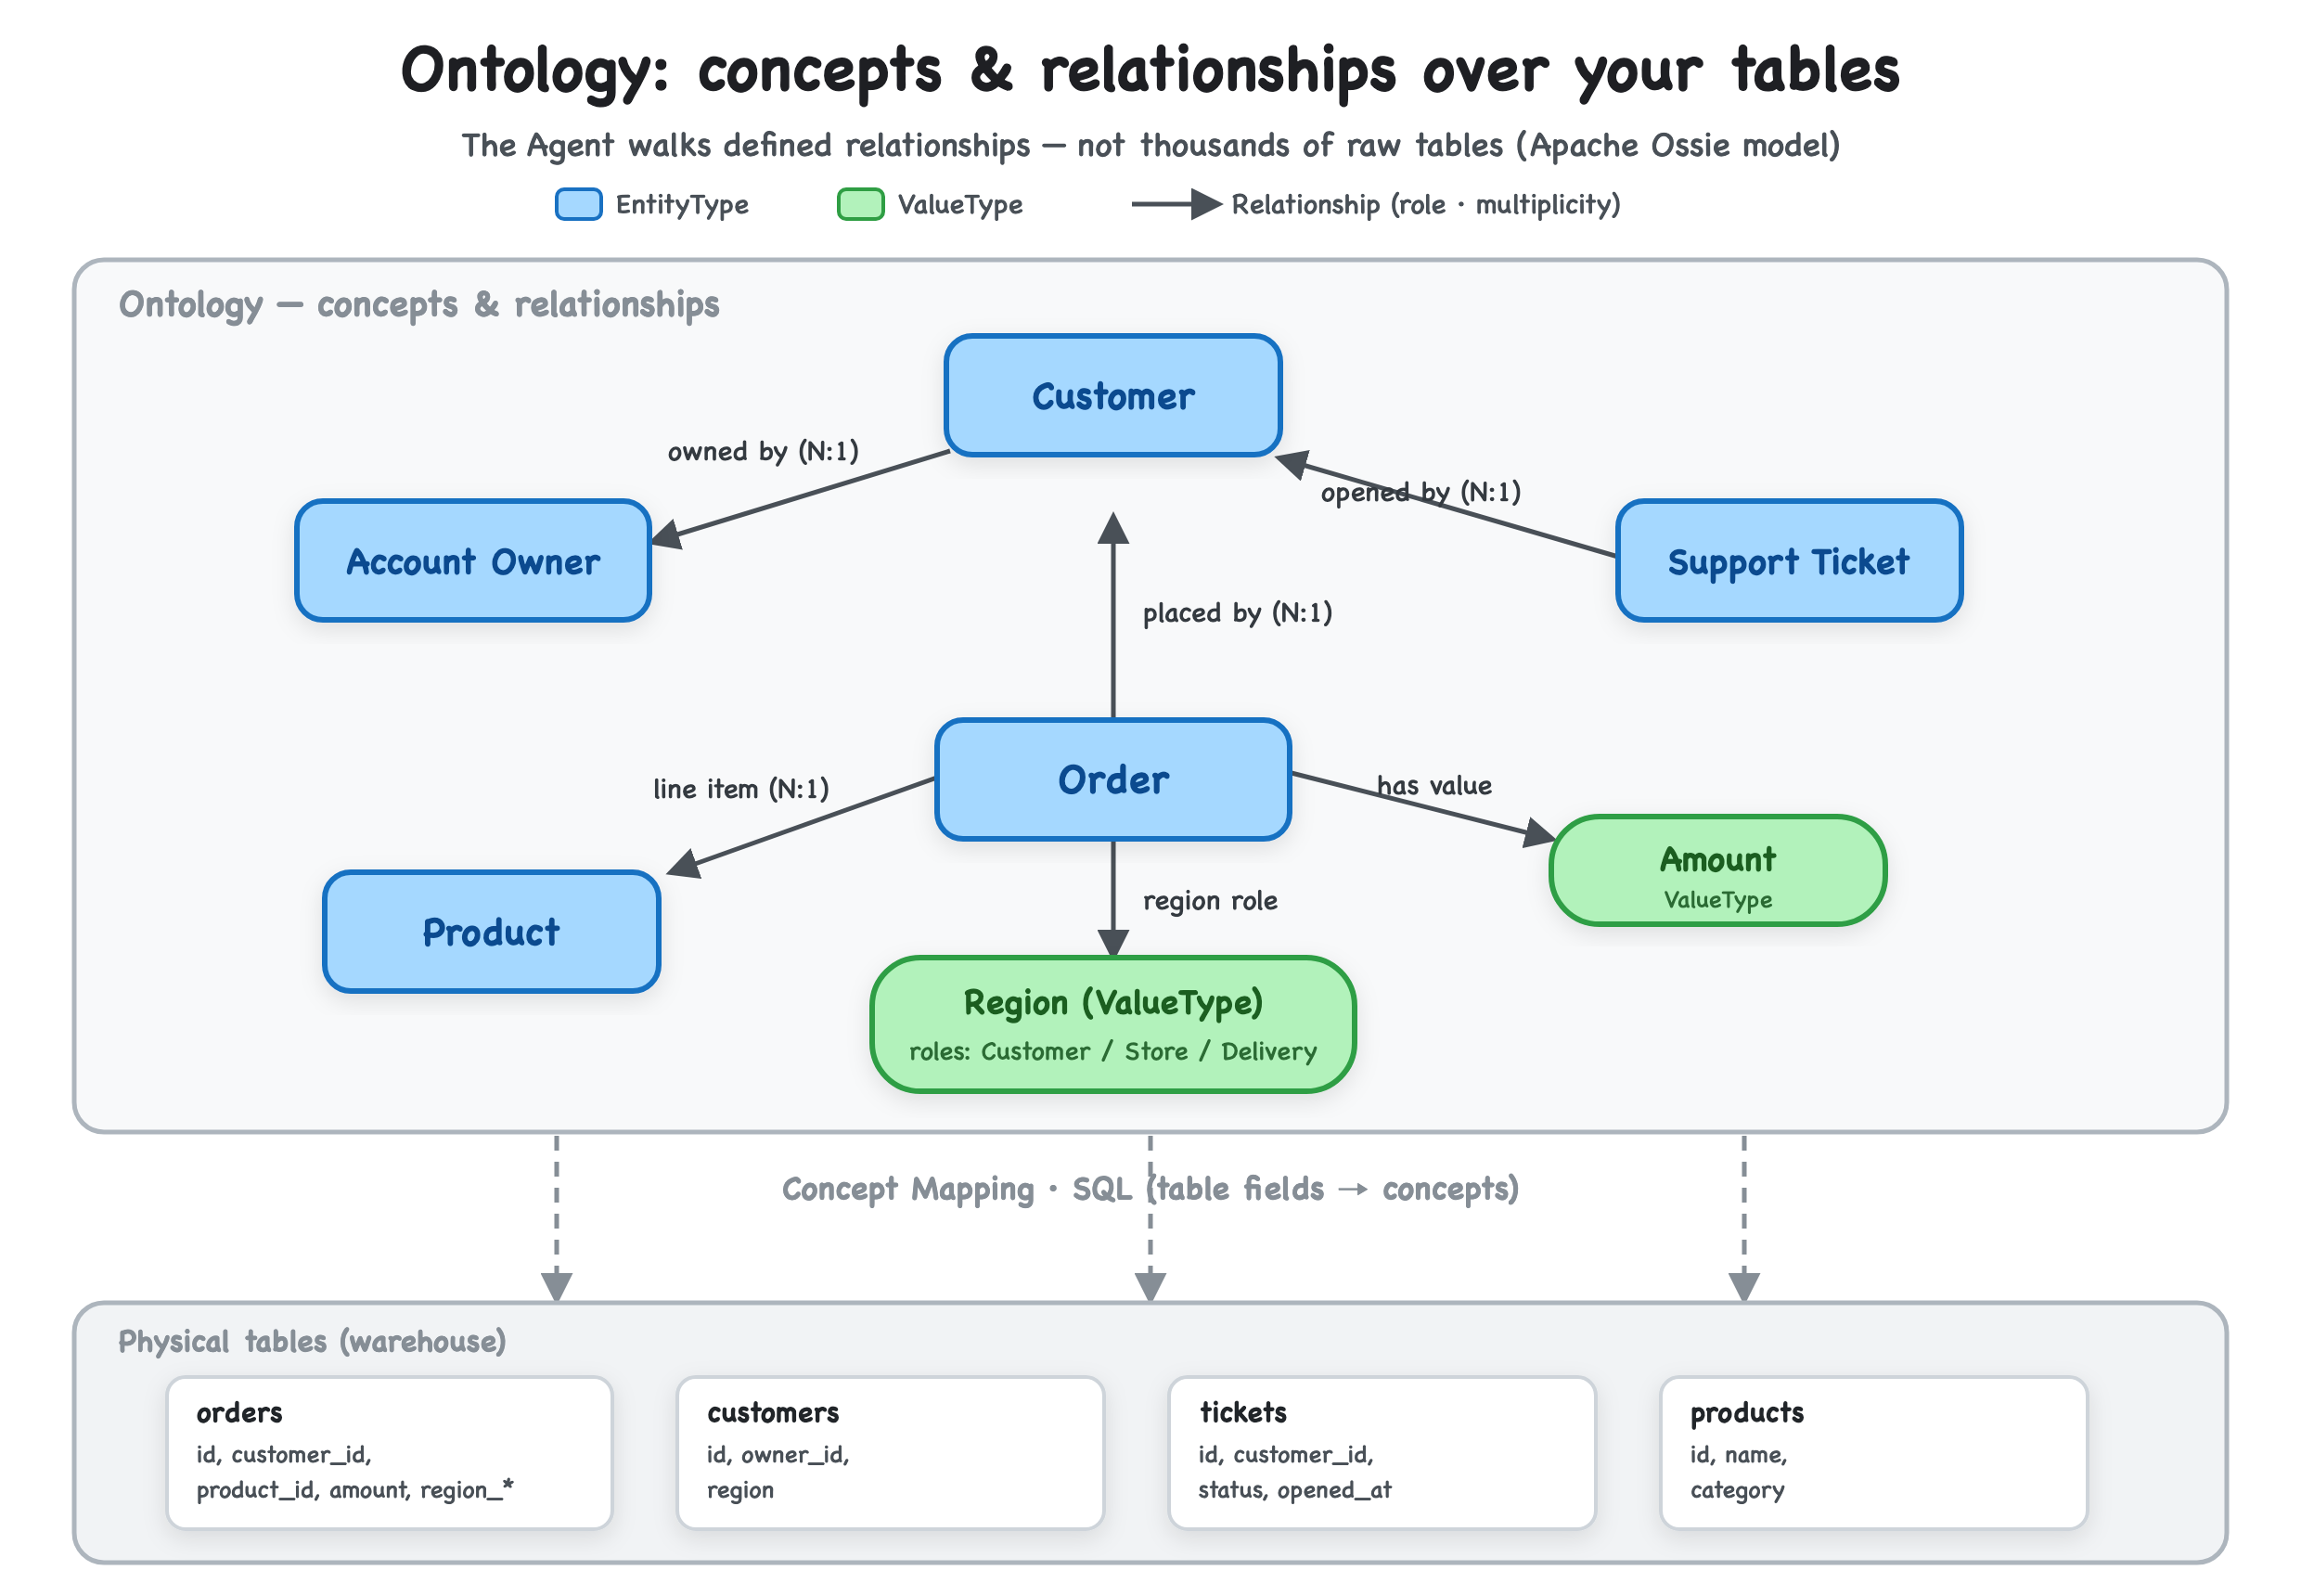
The agent walks defined relationships — not thousands of raw tables. Concepts map down to physical tables via an Apache Ossie model.
3. Metrics Keep Getting More Composable
The third thread is metrics themselves. A good semantic layer should cover more questions with fewer base metrics — the raw count of metrics doesn’t mean much. A base metric can take filters and windows or compose with other metrics, so many business metrics can be derived from a small set instead of maintained one by one. The closer a metric sits to a normalized table and the fuller its available dimensions, the more room there is to combine and extend later.
The deeper the composition goes, the more grain alignment matters — it’s what keeps a metric correct after you swap a dimension or cross datasets. Once metrics are genuinely composable, the agent isn’t staring at hundreds of independent metric configs anymore; it’s working with one semantic system it can derive from and verify against.
Those three bets are what this month’s work is really aiming at. Now, the releases.
September Releases
In September, Datus Agent shipped 0.4.1 and 0.4.2, and Dosi moved from 0.1.9 to 0.1.12. It was a dense month, with most of the work landing in metric analysis, multimodal input, database connectivity, plugins, and observability. Here’s the rundown by area.
Datus Agent 0.4.2
The piece I care about most in 0.4.2 is the metric analysis work. Datus can now discover which dimensions a metric supports first, then decide which one to analyze along. Wired up with Dosi’s attribution, the agent can go end to end — from querying a metric, to picking a dimension, to attribution and drill-down.
Take “why did revenue drop this month?” The agent queries the revenue trend, reads the available dimensions, expands along Region, Product, or Channel, then runs attribution methods like term-wise, mix-shift, and factor Shapley to keep going. For the user, that kind of question now runs from a single natural-language prompt to a fairly complete answer — no manual splitting into several queries along the way.
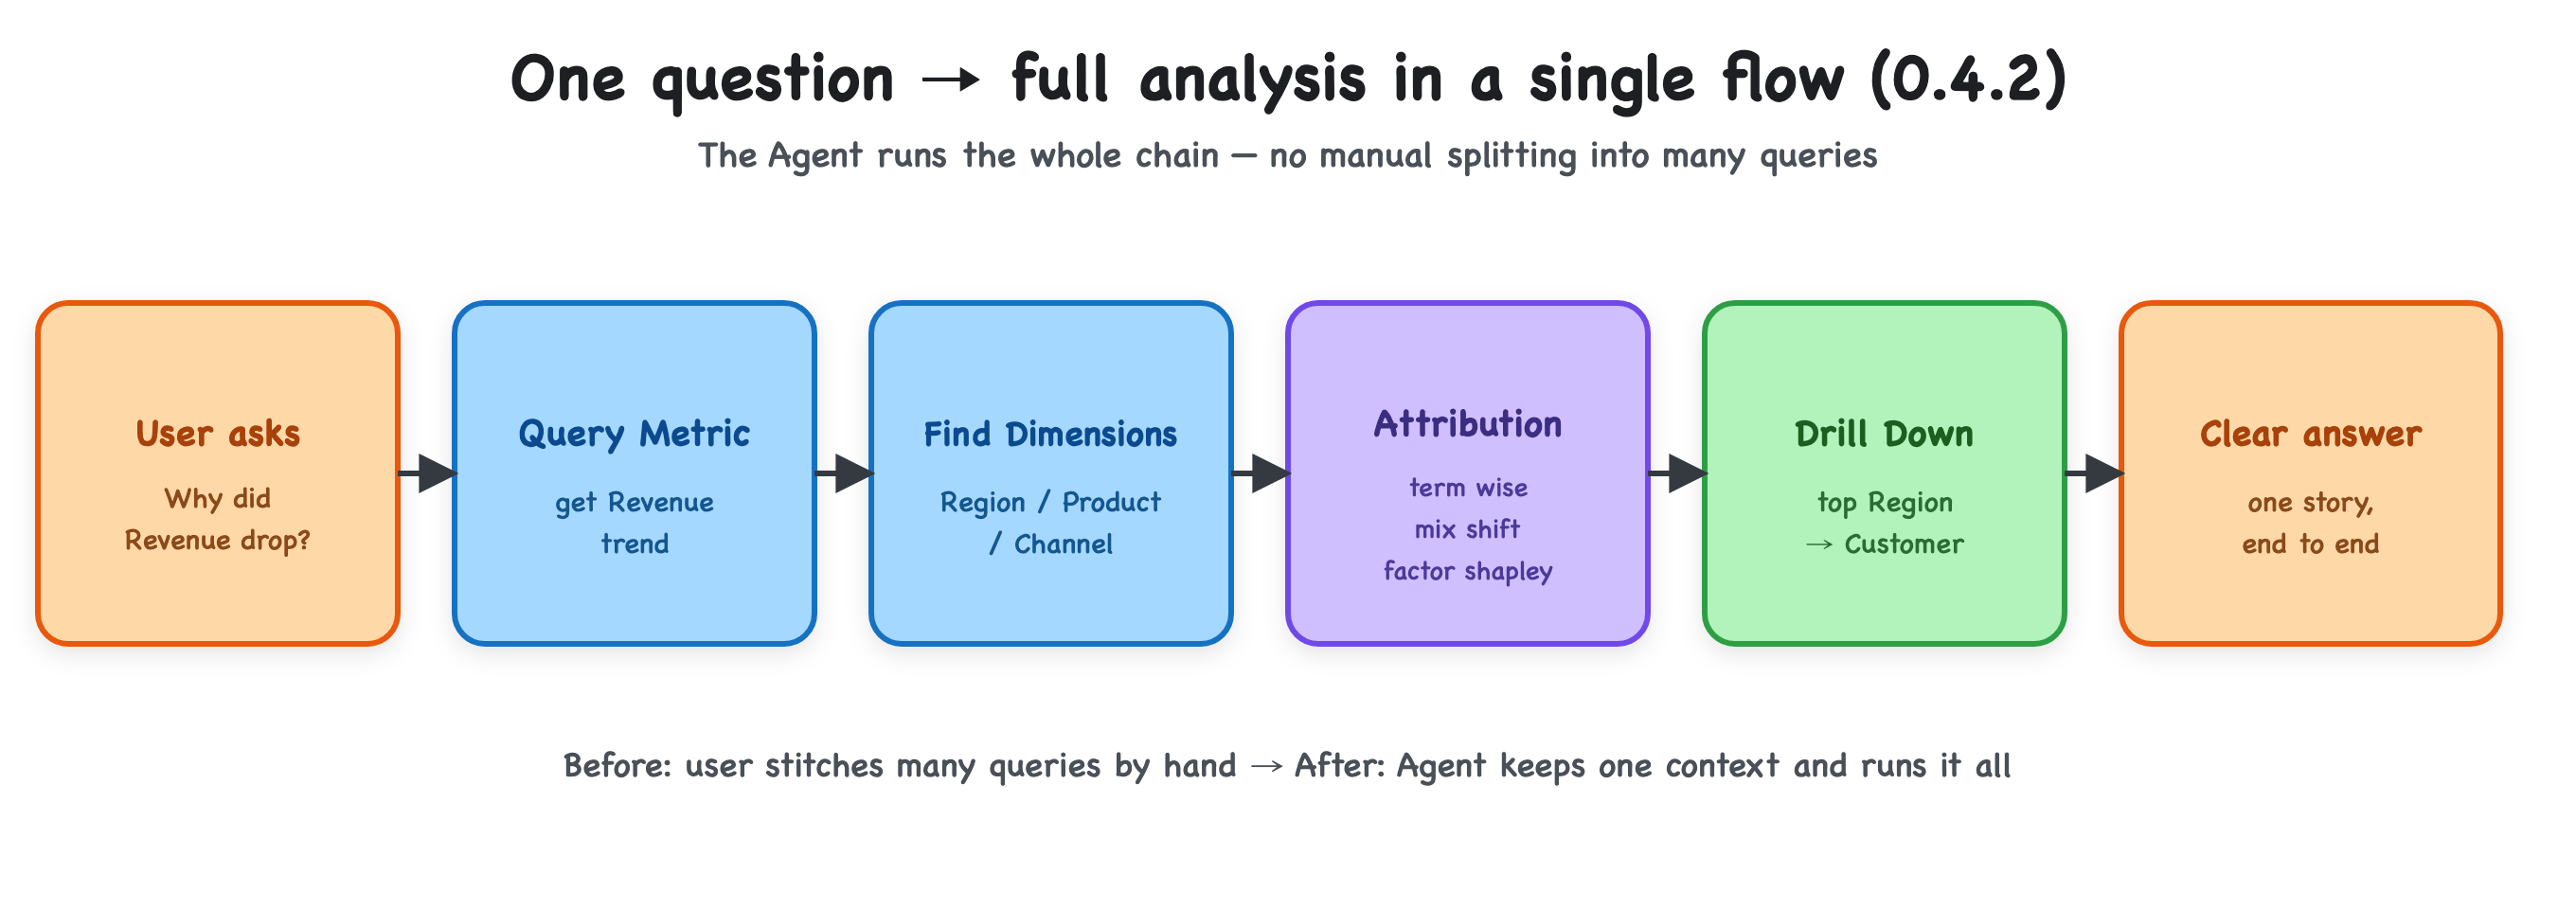
One question runs the whole chain — the agent keeps one context and runs it all.
This release also adds a read_image tool for PNG, JPEG, and WebP. Dashboard screenshots, ER diagrams, and charts can now go straight into a multimodal model. We also wired image context into session resume, context compaction, CLI display, and tracing, so when you reopen a session, images you used earlier can still feed into later analysis.
Model-call tracing got a pass too. Different model calls now show up in one observability view, with stats like prompt-cache tokens. As agent tasks get longer, call counts, token spend, cache hits, and latency become very real production signals — an area we’ll keep building out.
Datus Agent 0.4.1
0.4.1 leaned more toward the data stack and engineering side. On databases, we kept adding and hardening adapters — TiDB, BigQuery, MaxCompute, GaussDB DWS — so Datus can connect to more real enterprise environments.
The plugin system expanded as well, with Flink, Kubernetes, and EKS integrations. A Datus plugin is no longer just “add one more tool” — it can bundle the prompts, tools, skills, and context a class of data-engineering work needs, so the agent lands in a scenario with a complete working environment.
This matters for a data engineering agent because enterprise stacks are so fragmented: one task might touch databases, Spark/Flink, Kubernetes, a scheduler, and internal platforms all at once. Keeping the core focused on stable agent capabilities and letting the ecosystem plug in keeps maintenance sane over time.
Dosi 0.1.9 → 0.1.12
First, Dosi filled in Detail Query. The semantic layer used to be mostly about aggregate metrics; now you can go down to detail rows along the same semantic model. Find an anomaly via Revenue by Region, then drill into specific customers and orders — all reusing the relationships already defined in the model, without dropping out of the semantic layer to hand-write a whole new SQL.
Derived and composed metrics got stronger too. A metric can add filters or windows on top of a base metric, or combine with others, so a lot of business metrics can be derived from a small base set at much lower definition and maintenance cost. We’ve been tuning this steadily, aiming for a composable metric system rather than a pile of independent configs.
Grain alignment is another focus. When you combine metrics from different datasets, the classic failure is mismatched grain and fanout. D CONFORM added handling for many-to-many and similar relationships so cross-dataset metric combinations execute at the right grain. Users rarely see this directly, but it has a big impact on whether the results are correct.
Metric lineage keeps improving. You can now see which other metrics, datasets, and fields a metric depends on — context that becomes essential for impact analysis, debugging, and giving the agent something to explain with.
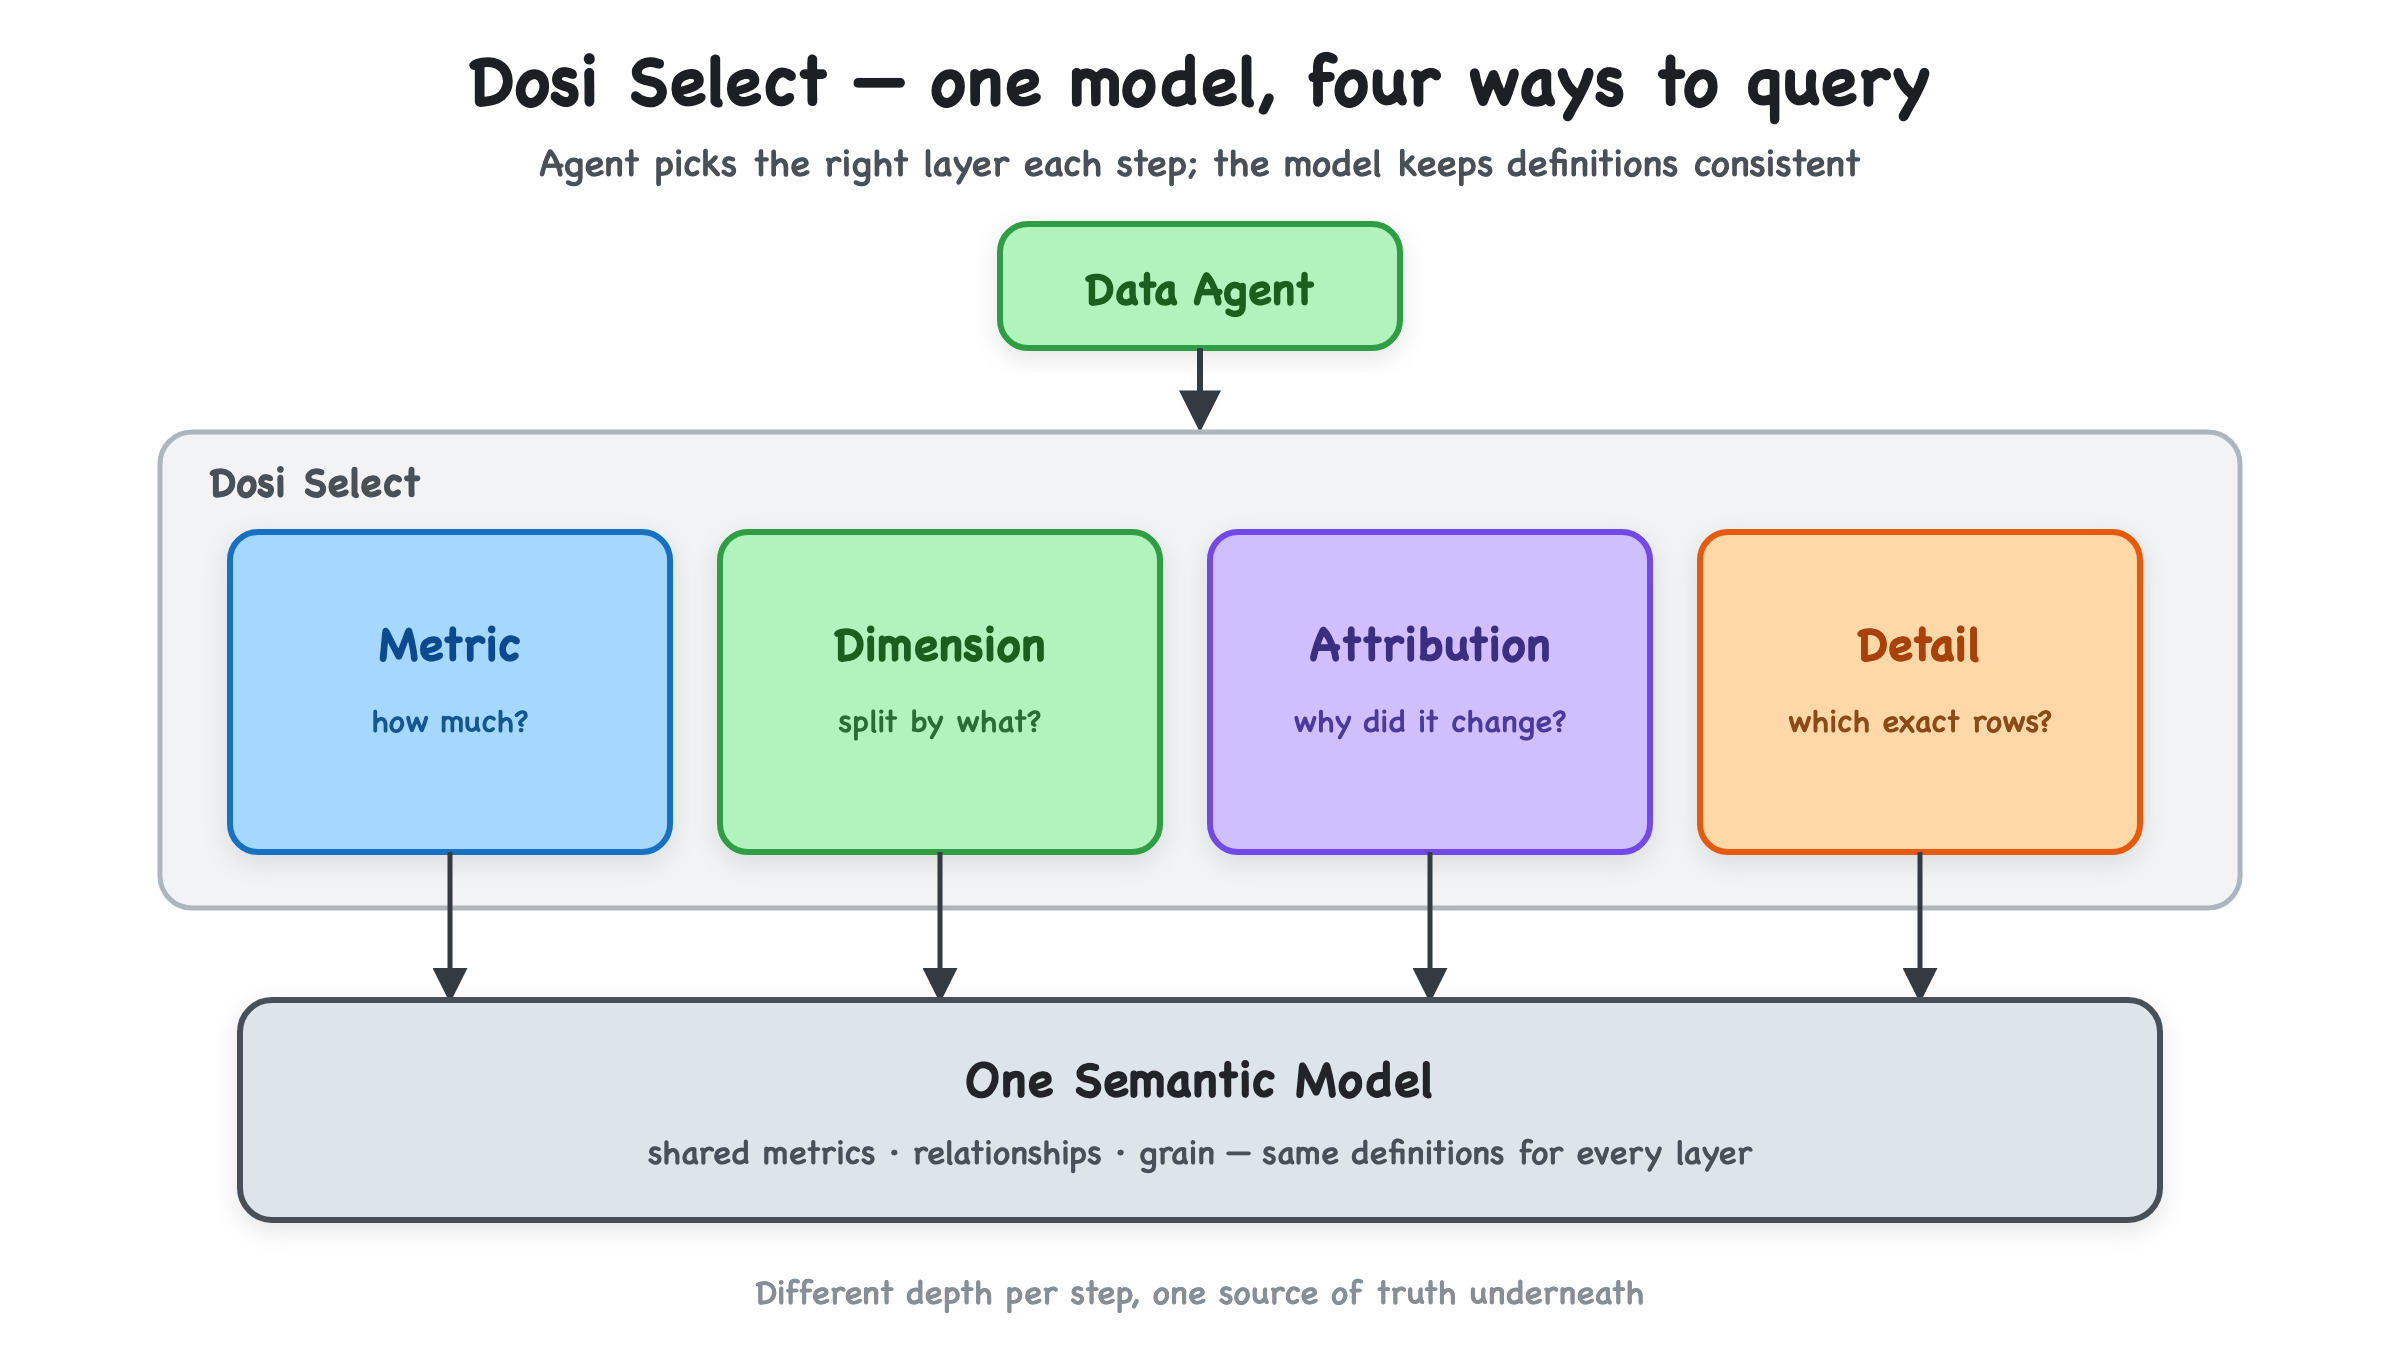
Different depth per step, one source of truth underneath.
Put together, Dosi’s query paths now cover Metric, Dimension, Attribution, and Detail. Internally we call this direction Dosi Select: the agent picks whichever depth a step needs, while the semantic layer keeps definitions and relationships consistent underneath.
Other Changes
Both releases carried plenty of smaller quality and stability fixes — across sessions, context compaction, tracing, and database-specific compatibility. Each looks minor on its own, but once an agent is actually running for a while, these details decide the day-to-day experience, and they’ll stay a long-term investment.
Wrapping Up
After September, Datus’s direction hasn’t really changed. Datus keeps organizing data-engineering tools, context, and execution flow into the agent; Dosi keeps turning the semantic layer into something the agent can execute directly. Metrics, dimensions, attribution, detail, images, and more data systems are all moving into one analysis flow — and the next step is still to make that loop complete.
Datus Agent 0.4.2 and Dosi 0.1.12 are out now. Install the Datus agent (pip install datus-agent) or read the docs, and give them a try.
Frequently asked questions
What does “the semantic layer in the agent loop” actually mean?
It means the semantic layer stops being just a place to look up metric definitions and becomes a deterministic checker inside the agent’s step-by-step analysis. At each step the agent proposes — split this metric by that dimension, join these two datasets, drill into detail rows — the semantic layer decides whether that step is valid: whether the metric supports the dimension, whether the two metrics share a grain, whether a join will fan out. The agent keeps choosing what to explore; the semantic layer keeps the chain correct.
Why isn’t good text-to-SQL enough for a trustworthy data agent?
Because a single valid query is a much lower bar than a correct multi-step analysis. A model can write a dozen SQL statements that all run cleanly, yet the overall answer is still wrong if one step mixes grains, fans out on a join, or reads an ambiguous “Region” the wrong way. Each SQL is fine; the meaning drifts across the chain. That’s why the longer the analysis, the more it needs a deterministic layer checking each step rather than better one-shot text-to-SQL.
What is Dosi Select?
Dosi Select is our internal name for the set of query paths Dosi now exposes over one shared semantic model: Metric (how much?), Dimension (split by what?), Attribution (why did it change?), and Detail (which exact rows?). The agent picks whichever depth a given step needs, and the same definitions, relationships, and grain apply underneath all four — so switching from a metric trend to a detail-row drill-down doesn’t mean dropping out of the semantic layer to hand-write new SQL.
What changed in Datus Agent 0.4.2 and Dosi 0.1.12?
Datus Agent 0.4.2 added end-to-end metric analysis (dimension discovery plus Dosi attribution), a read_image tool for PNG/JPEG/WebP multimodal input wired through session resume and tracing, and clearer model-call observability. Dosi moved from 0.1.9 to 0.1.12, filling in Detail Query, strengthening derived and composed metrics, adding grain alignment for many-to-many relationships (D CONFORM), and improving metric lineage. Datus Agent 0.4.1 focused on database adapters (TiDB, BigQuery, MaxCompute, GaussDB DWS) and plugins (Flink, Kubernetes, EKS).
Do I still need an ontology if I already have a semantic layer?
An ontology is worth adding once your questions cross objects and relationships, not just metrics — “which customers drove the drop, and did they file support tickets?” A semantic layer governs how metrics are computed; an ontology bounds the business world the agent may explore, pins down ambiguous concepts like Region, and stitches separate semantic models together. Many teams get value from a light ontology grown out of the metrics they already use. See semantic layer vs ontology for where each one fits.
Related articles
- What Makes a Semantic Layer Truly AI-Native? — why the semantic layer needs a runtime, not just a spec, to enter the agent’s reasoning loop.
- Introducing Dosi: OSI-Native Semantic Layer for Metrics — the engine behind these releases, compiling Apache Ossie models to native SQL.
- Dosi MCP Semantic Layer for Agents — No SQL Guessing — governed metric names and structured errors instead of free-writing SQL.
- What Is an Ontology? Definition, Three Productizations & AI Agents — the bounded business world an agent is allowed to explore.
- Semantic Layer vs Ontology: Why AI Agents Need Both — how the metric plane and the entity plane fit together.
- What Is a Data Engineering Agent? (2026) — the category these releases build toward.