
Semantic Model Examples: A Working Apache Ossie Model
See semantic model examples for revenue, customer regions, and average order value. Download a tested Apache Ossie YAML model and check its answers yourself.
TL;DR
- A semantic model names the business metrics, fields, and relationships that turn source tables into answerable questions.
- This worked example uses one small order dataset to answer three questions: completed revenue, revenue by customer region, and average order value.
- The model and sample data are downloadable, and the displayed answers were checked with Dosi 0.1.11.
The example data and the questions it must answer
A semantic model example is most useful when you can follow one business question from source rows to a metric definition and then verify the result. Here we use a small retail model to do that three times. The goal is to show what each part of the model contributes, not just present a YAML file that looks plausible.
If you need the definition first, read what a semantic model is. This guide starts where that definition ends: with data, executable examples, and the decisions a model author has to make. You can download the complete Apache Ossie model and sample SQL to follow along.
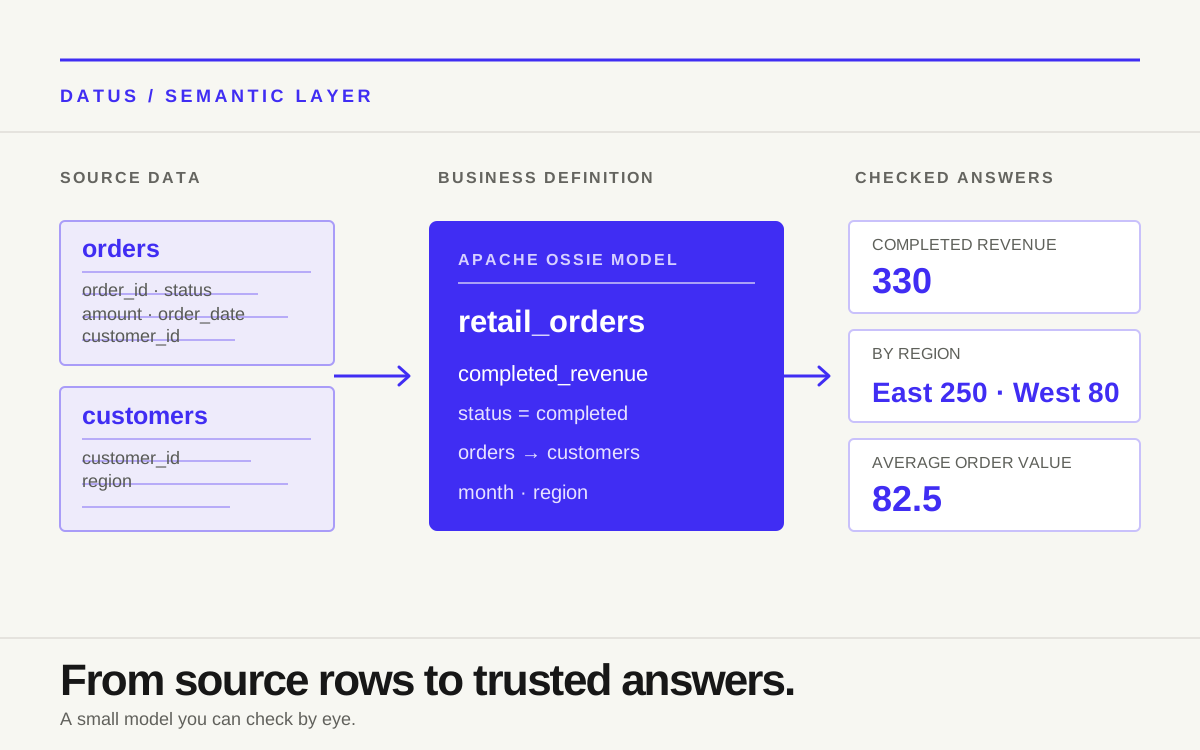
Our sample database has two tables. orders records each order, including its customer, date, status, and amount. customers records each customer’s region. Each order has one customer. That grain matters: the model can join an order to a region without multiplying the order amount.
The six sample orders include four completed orders and two cancelled ones. A business owner decides that completed revenue includes only completed orders. The source rows add up to 330 for that metric: 120 + 30 + 80 + 100. The cancelled amounts, 60 and 40, do not contribute. This is a deliberately small dataset, so anyone can check the answer by eye.
| Business question | Expected answer | What the model must know |
|---|---|---|
| How much completed revenue did we earn? | 330 | Which status counts, and which amount to sum |
| How much came from each customer region? | East 250; West 80 | How orders.customer_id joins to customers.customer_id |
| What was average order value? | 82.5 | Completed revenue ÷ four completed orders |
The point is not that 330 is a realistic company KPI. It is a test case. If a chart or agent returns 430 by including cancellations, the error is immediately visible. A larger example with thousands of rows might look impressive while making a wrong definition harder to spot.
The Apache Ossie core specification separates datasets, relationships, fields, and metrics. Dosi reads an Ossie model and compiles a request against the selected database. We use those same pieces below, beginning with the simplest metric.
Before reading any YAML, write down the answers you expect from the raw rows. That gives the model an independent check. If you start by accepting whatever the semantic engine returns, it is easy to mistake a valid query for a valid business result. Our expected totals come from the six insert statements in the downloadable seed, not from the output of the model we are trying to test.
It also helps to separate a physical fact from a business choice. The physical fact is that an order row has an amount and a status. The business choice is that cancelled orders should not count toward completed revenue. The model records the choice, so it can be inspected and changed deliberately. A row-level source table remains the place to verify that the choice was applied to the right records.
Example 1: a metric with a business rule
The physical table contains amount and status. Neither column alone says what the business means by revenue. A naive SUM(orders.amount) would include cancelled orders and return 430. The model gives the agreed term a name and puts the status rule inside its expression:
metrics:
  - name: completed_revenue
    description: Order amount from completed orders only
    expression:
      dialects:
        - dialect: ANSI_SQL
          expression: "SUM(CASE WHEN orders.status = 'completed' THEN orders.amount ELSE 0 END)"
This is an excerpt from the complete model, not a standalone file. The metric lives at the semantic-model level; orders.amount and orders.status refer to fields declared in the orders dataset. The definition makes cancellation treatment explicit, so a dashboard and an agent can request the same named metric instead of independently guessing which SQL to write.
There is still a human decision inside this example. Some businesses recognize revenue when an invoice is paid, not when an order is completed. Others subtract refunds recorded in a separate table. A model author cannot infer the correct policy from column names. The approved business rule should come from the metric owner, and the source data should contain enough information to apply it.
Notice that the metric is named completed_revenue, not simply revenue. The narrower name tells a reader what population it measures. A description then states the rule in ordinary language. Both matter to an agent or an analyst browsing available metrics: a formula may be precise, but a person should not have to reverse-engineer SQL to discover whether cancellations are included. If the company later adopts a different revenue-recognition rule, that can become a separate metric until the owner decides whether it replaces this one.
This model also uses ELSE 0, which makes the metric return zero for a group containing only cancelled orders. For the small dataset, March has one cancelled order, so a monthly request returns March with revenue 0. If March contained no order rows at all, the query would return no March group. Filling an absent month requires a date spine or another explicit design choice. Those two situations should not be mistaken for one another.
Example 2: break the metric down by region and month
To ask for revenue by region, the model needs more than a metric. It needs the region field and the relationship from each order to its customer. In the downloadable file, customers has a primary key and a region field. The relationship points from the many side (orders) to the one side (customers):
relationships:
  - name: orders_to_customers
    from: orders
    to: customers
    from_columns: [customer_id]
    to_columns: [customer_id]
This declaration gives a query engine a join path. When the query asks for completed_revenue grouped by customers.region, Dosi compiles a join from orders to customers and groups the result by region. On the sample data, East has 120 + 30 + 100 = 250; West has 80. The cancelled West order does not affect the total.
The generated SQL makes the contract visible. Dosi reads the named metric and the named dimension, then selects customers.region and joins the tables on customer_id. The business application does not have to handwrite that join for each question. You can inspect the compiled SQL before adding --execute; this is useful when a result looks surprising because it shows the path the engine chose.
SELECT customers.region AS region,
       SUM(CASE WHEN orders.status = 'completed'
                THEN orders.amount ELSE 0 END) AS completed_revenue
FROM main.orders AS orders
LEFT JOIN main.customers AS customers
  ON orders.customer_id = customers.customer_id
GROUP BY customers.region
This is the actual query shape compiled from the downloadable model for the region request. The LEFT JOIN keeps orders whose customer does not match a row in customers, but their region would be null. If your production question requires every order to have a known region, a null bucket is a data-quality signal to investigate, not a reason to quietly drop those orders.
That result depends on the key being genuinely unique in customers. Declaring primary_key: [customer_id] in a model does not repair duplicate customer rows in a database. If a customer appears twice in the dimension table, a join can multiply revenue. Check uniqueness in the source and compare the grouped total with the ungrouped total. Both should sum to 330 for this example.
The same model marks orders.order_date as a time dimension:
- name: order_date
  expression:
    dialects:
      - dialect: ANSI_SQL
        expression: order_date
  dimension:
    is_time: true
Now a query can request orders.order_date:month. Dosi returns January 150, February 180, and March 0. The time flag tells the engine that it may bucket the field by month; it does not decide whether the date should be order creation, completion, payment, or revenue recognition. We chose an order_date column because this is a teaching example. For a real revenue metric, verify the date with Finance before you ship a monthly chart.
The region and month examples use the same completed_revenue metric, but they ask different questions of it. A region groups by a field from another table; a month groups by a time field on the order itself. This is why a semantic model needs both relationships and dimensions. A list of formulas alone cannot tell a query engine how to reach customer region, and a list of table joins alone cannot say which order statuses count as revenue.
Example 3: a ratio that must be calculated at the requested grain
Average order value is not the average of displayed monthly averages. It is total completed revenue divided by the number of completed orders in the group being requested. For all sample data, that means 330 ÷ 4 = 82.5.
The model makes both the denominator and the division rule explicit:
metrics:
  - name: completed_orders
    description: Number of completed orders
    expression:
      dialects:
        - dialect: ANSI_SQL
          expression: "COUNT(CASE WHEN orders.status = 'completed' THEN orders.order_id END)"
  - name: average_order_value
    description: Completed revenue divided by completed order count
    expression:
      dialects:
        - dialect: ANSI_SQL
          expression: "SUM(CASE WHEN orders.status = 'completed' THEN orders.amount ELSE 0 END) / NULLIF(COUNT(CASE WHEN orders.status = 'completed' THEN orders.order_id END), 0)"
NULLIF(..., 0) prevents division by zero. In a group with no completed orders, average order value is undefined; it should not be reported as a meaningful zero. If your reporting policy calls for a different display, document that choice in the consuming interface. Do not change the mathematical definition silently.
Why calculate the ratio at query time? January has 150 from two completed orders, so its average is 75. February has 180 from two, so its average is 90. In this toy data, their simple average happens to equal the overall 82.5 because the order counts match. With unequal counts, averaging the two monthly rates would be wrong. A semantic model helps by asking the engine for the ratio at the requested grouping grain rather than shipping a precomputed percentage that a dashboard might re-aggregate.
Try an uneven case by adding one more completed January order worth 30. January would then have 180 across three orders, an average of 60. February would remain 180 across two, an average of 90. Averaging those monthly values gives 75, while the correct all-period average is 360 ÷ 5 = 72. The difference is small in this toy example, but the mistake is structural: a ratio needs its numerator and denominator at the requested grain. This is a good regression case to keep when you move the model into a dashboard or app.
The expression repeats the revenue and order-count logic rather than referencing the names of the other two metrics. That repetition is a limitation of this particular core-model expression style. Keep related definitions under review together. If a business owner changes which statuses count, update all three expressions and the expected test results in one change. A reviewable file makes that change visible; it does not make it automatic.
Run the complete model yourself
Download model.yaml and seed.sql into the same folder. The seed creates the two tables in a local DuckDB database. With the Dosi CLI and DuckDB CLI installed, run:
duckdb retail.duckdb < seed.sql
dosi validate --model model.yaml
dosi query --model model.yaml \
  --metrics completed_revenue,completed_orders,average_order_value \
  --execute --db retail.duckdb
The expected row is 330, 4, and 82.5, in that order. Validation checks model structure, references, and metric expressions before execution; it cannot certify that your business definition of “completed” is correct. The Dosi CLI reference describes these checks and query flags.
Next, ask for the region and month breakdowns:
dosi query --model model.yaml --metrics completed_revenue \
  --group-by customers.region --execute --db retail.duckdb

dosi query --model model.yaml --metrics completed_revenue \
  --group-by orders.order_date:month --execute --db retail.duckdb
The first command returns East 250 and West 80. The second returns January 150, February 180, and March 0. You can omit --execute to see the SQL Dosi would generate before it runs. For a longer first-run walkthrough using Dosi’s bundled sample, see the official metric-query tutorial.
These values were checked against Dosi 0.1.11, not invented from the model’s labels. Change one seed row or the completed-status rule and rerun the three queries. That is a quick way to see whether the model still answers the business questions you intended.
Validation, compilation, and execution answer different questions. Validation asks whether the model is structurally usable: names are unique, relationships reference real fields, and metric expressions compile. Compilation shows the SQL the engine plans to send to the database. Execution tests that SQL against actual rows. None of the three decides whether Finance approved the revenue rule. That last check requires a known answer and a person responsible for the definition.
A practical review can therefore be short but specific: keep the seed data in version control, run dosi validate, execute the three queries, and compare their outputs with the expected values above. Include a cancelled-only month and a group with no matching customer. When the model changes, the reviewer can see whether the expected results changed for a good reason. For a larger dataset, preserve a handful of similarly small, representative cases instead of relying only on one production total.
How to adapt the example without copying its mistakes
First, replace the physical sources with your own tables or views. The example’s main.orders and main.customers refer to a local DuckDB database. In another database, the source names and dialect configuration may differ. Keep the business names understandable even if the physical table names are not.
Second, verify the grain of each source. This demo has one row per order. If your source has one row per order item, COUNT(orders.order_id) may count items rather than orders, and SUM(amount) may include duplicated order totals. You might need a distinct count, an order-level mart, or a different metric expression. The right choice depends on what a row actually represents.
Third, check the relationship’s cardinality. We use one customer row for each customer_id, allowing each order to inherit one region. If you instead join to a customer-history table with multiple records per customer, choose a valid time-aware row before adding its region to a revenue breakdown. A syntactically valid relationship can still answer the wrong question.
Fourth, decide how your application handles access and explanations. This sample defines calculations; it does not define who may see which customers. It also does not ensure that a natural-language question selects the right metric. An agent can use named metrics as a safer starting point, but your application still has to map a user’s words to a metric, enforce access, and show filters and dates alongside the answer. The semantic layer in the agent loop explains that handoff in more detail.
Before publishing a model, ask which fields people should actually be allowed to group by. A primary key may be required for a join without being a useful dashboard axis. A raw amount field may exist so that a metric can aggregate it without being a meaningful standalone dimension. Dosi can infer some field roles, but the author should review the list of exposed dimensions and explicitly mark fields where the inferred role is not what users need. That review makes an agent’s choices narrower and a human explorer’s menu easier to understand.
Finally, pin the format to the engine you use. As of October 2026, the installed Dosi 0.1.11 release accepts the semantic_model: list form used in this downloadable file. The current Apache Ossie development specification describes a newer flat, one-model-per-document shape. The Dosi CLI docs explicitly warn that upstream main and this engine release do not yet use the same document shape. Do not paste this file into a different validator and assume that matching version text makes the structures interchangeable. Validate against the release you will actually run, and migrate the wrapper when your runtime supports the newer form.
Conclusion
A good semantic model example shows more than YAML syntax. It exposes a business rule, connects it to data at a known grain, and gives you an expected answer you can verify. In this example, one completed-revenue definition supports an overall total, a region breakdown, a monthly view, and a ratio. The real work begins when you adapt those choices to your own data and have someone accountable for the resulting numbers.
Frequently asked questions
What is a simple example of a semantic model?
A retail model can map an orders table and a customers table, define completed revenue as the sum of completed order amounts, and connect each order to its customer’s region. It can then answer “How much completed revenue did we earn?” and “How much came from each region?” using the same metric definition.
Do I need a separate metric for every chart?
No. A metric represents an agreed calculation, while a chart chooses how to present it. One completed-revenue metric can be grouped by month or customer region if the model defines those fields and their relationships. New business calculations, such as average order value, need their own reviewed definitions.
Why does the sample have both datasets and metrics?
Datasets describe where the fields come from and how tables relate. Metrics describe what to calculate from those fields. The distinction matters because orders.amount is simply a column; completed revenue adds the rule that cancelled orders are excluded.
Can this file be used with every Apache Ossie tool?
Check the version and document shape first. The downloadable file was validated with Dosi 0.1.11, which reads a semantic_model: list. The unreleased Apache Ossie 0.2 development spec uses a flat document shape. A portable standard helps exchange meaning, but a specific runtime still has to support the same version and features.
Does a valid model guarantee a correct business answer?
No. Validation catches structural and expression errors. It cannot decide whether “revenue” should exclude refunds, which date Finance uses, or whether customer keys are unique in the data. Compare results with known examples, have an owner approve definitions, and repeat the checks when either the data or the rules change.
Related articles
- What is a semantic model? — the concept behind these examples
- What is a semantic layer? — how models serve a larger business vocabulary
- What is conversational BI? — one interface that can use shared definitions
- The semantic layer in the agent loop — how agents use governed definitions