
What Is Headless BI? Shared Metrics Beyond Dashboards
Headless BI separates business metrics from dashboards so apps and AI agents can use them too. Learn when it helps, where it breaks, and how to test it.
TL;DR
- Headless BI keeps business definitions separate from the interface that displays results.
- It is useful when dashboards, applications, notebooks, or agents need the same metrics.
- It still takes work to connect each consumer and keep calculations, access, and performance correct.
- Dosi offers a vendor-neutral semantic engine built on the open Apache Ossie standard; each consumer still needs a tested integration.
Headless BI separates the meaning and calculation of business metrics from any one dashboard interface. A shared semantic layer defines a metric such as net revenue, accepts a request for it, and returns a result to the application that asked. That application decides whether to show a chart, a table, or an answer in a conversation.
The idea is simple. Making it useful is harder: the same number must still mean the same thing when it reaches different tools. Headless BI is a way to organize that work, not a guarantee that every interface will agree automatically.
What does “headless” mean in BI?
In a traditional BI setup, the report builder and its business model often live in the same product. A report calculates a metric and presents it. With headless BI, the business model is a separate service. The presentation layer can be a dashboard, an internal app, a notebook, or an AI agent.
Imagine a retailer that defines net revenue as completed order value minus refunds. Finance sees it on a monthly dashboard. A product team shows it in an internal app. An agent uses it to answer “How did Europe perform last quarter?” If each surface writes its own SQL, the definitions can drift. A shared model gives them a common starting point.
Data consultant Wesley Nitikromo describes this repetition as the same revenue definition being rebuilt in successive tools. His point is about ownership of the definition, not about replacing every interface. The dashboard still has a job: helping people see and explore the result.
| Layer | What it owns in the example |
|---|---|
| Warehouse or database | Orders, refunds, customer records, and query execution |
| Shared semantic model | What “net revenue” means, the relevant dates, relationships, and valid breakdowns |
| Consumer | The chart, app screen, notebook analysis, or agent response |
This is a headless semantic layer when the model and query capability are exposed independently of a specific visualization front end. A semantic layer can also live inside a BI tool; “headless” describes how its capabilities are made available to other consumers.
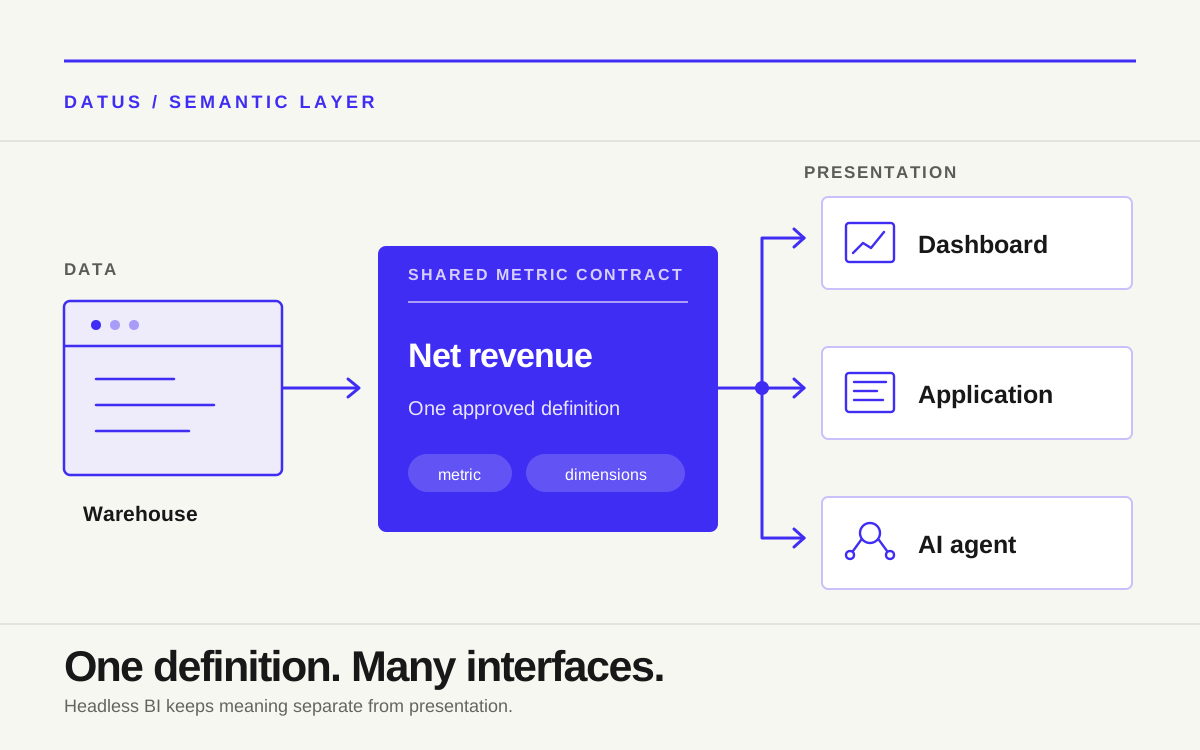
The business definition is shared; each interface still owns its presentation and integration.
How is headless BI different from traditional BI?
The practical difference is where a definition lives and how another tool can use it. A dashboard with a well-maintained internal model may already give its users consistent metrics. Moving that model outside the dashboard adds value only when another real consumer needs the same logic.
| Question | Model inside one BI tool | Headless model |
|---|---|---|
| Where is net revenue defined? | In the BI environment | In a shared service or specification |
| Who can use it directly? | Usually that tool and its supported integrations | Consumers that have a working integration |
| Who builds the chart? | The BI tool | Each consuming application |
| What must be maintained? | The model and reports | The model, its service, and each integration |
An API alone does not make a metric portable. Consumers differ in how they request totals, apply filters, combine measures, and show missing values. A headless layer should reduce duplicated business logic; it does not remove every consumer’s own presentation and access responsibilities.
Is a data mart already enough?
A data mart can make the source easier to use. The retail team might publish an orders_reporting table with refunds already accounted for. Every tool can read it, and that may be sufficient for a fixed report. But a table alone does not answer every question about a metric: which date is authoritative, whether revenue may be grouped by customer region, or how a ratio should be rolled up. Those choices often reappear in the consuming tool.
The distinction is not that one approach is modern and the other is old. A mart organizes data at a useful grain; a semantic model describes how business questions map to that data. Many teams need both. A well-designed mart can simplify the semantic model, while a semantic model can keep several consumers from embedding different calculations on top of the same mart.
For a team with one stable report, a documented mart and a governed BI model may be the shortest path. When the same measure appears in an app, a notebook, and an agent, the work of maintaining those separate interpretations becomes more visible. That is the point at which a shared query contract starts to earn its cost.
Where do teams run into trouble?
The strongest objection to headless BI is also a useful design test: what happens after a metric leaves the shared layer?
The dashboard calculates again
Suppose the shared layer returns monthly conversion rates. If the dashboard imports those percentages and sums or averages them without the underlying counts, its quarterly figure may be wrong. Chris Webb, who works on Microsoft’s Fabric CAT team, explains this issue for third-party semantic models connected to Power BI. His broader warning is that putting one semantic model on top of another can change the calculation, even when a connection technically works.
That perspective matters whether or not you use Power BI. A connector proves that data moves; it does not prove that ratios, subtotals, or other non-additive metrics survive the trip. Compare the final number in each interface with a reviewed reference query, especially at grand totals and drill-downs.
For example, a dashboard may show conversion rates of 10% and 20% for two regions. The combined rate is not necessarily 15%: it depends on how many visitors and conversions each region contributed. A metric service should return the combined rate at the requested grain, or provide enough base measures to calculate it correctly. The consumer must not treat a precomputed percentage as if it were an additive count.
The source data cannot answer the question as asked
A data engineering discussion about monthly shipments raises a concrete problem: a customer with no shipments in a month may disappear from a chart. Whether the result should show zero, a blank, or no row depends on the business question and the data model. A semantic layer cannot infer that choice from a missing record alone.
For a continuous time series, decide where missing periods are filled: in an upstream date spine, in a supported query operation, or in the presentation layer. Test the result for a customer with no activity, not just for one whose chart already looks complete. The forum discussion is an example of a failure mode, not a benchmark of any particular product.
A second service creates a second responsibility
An independent layer needs deployment, authentication, monitoring, and a process for changing definitions. The application still needs to display errors well and enforce the access rules that apply to its users. BI practitioner Alexander Korn argues that a separate model can add cost and governance seams when one BI tool already serves the organization well.
That is a fair challenge. Before adding a new layer, name the second consumer and the metric it needs. “We might use agents someday” is less convincing than “our dashboard and support app currently calculate active customers differently.”
The access boundary deserves the same attention. A shared metric may be correct in both an executive dashboard and a customer-facing application, but the second surface must restrict customers to their own records. Do not assume that putting the metric behind an API automatically carries over the BI tool’s user permissions. Specify which component authenticates the person, how that identity reaches the query, and where row-level restrictions are enforced. Test with a user who should see less than the metric owner, not just with an administrator account.
When does a shared layer earn its place?
Headless BI makes the most sense when the same business concept has to travel across distinct interfaces. The key signal is repeated definition work, not the number of dashboards.
For example, an app and an agent both need active customers. The team agrees on the period, qualifying events, and customer identity rule. It records the definition once, then tests both consumers against the same known cases. The app can show a trend; the agent can answer a follow-up question. Neither has to guess the meaning from table names.
One well-governed BI tool can also be enough. If all your users work there and its model already supports their workflows, an additional service may add maintenance without reducing duplication. The benefit grows as distinct consumers need the same metrics, while integration and operations remain real costs.
There is also an ownership question. The team that approves the metric should be able to understand the definition, even if engineers maintain the model. If finance changes the treatment of refunds, an owner should review the change, and each consumer should be checked against a known example before the new definition is relied on. “Define once” saves duplicate editing; it does not remove the need to communicate a definition change.
The decision is therefore less “headless or dashboards?” and more “where should the agreed definition live so every actual consumer can use it correctly?” Conversational BI is one such consumer. It adds the work of following a user’s questions; the semantic model supplies business meaning underneath.
How does Dosi approach headless BI?
Dosi is a semantic engine built around Apache Ossie, an open standard for describing datasets, relationships, dimensions, and metrics. A team can define a metric in an Ossie model; Dosi validates the model and generates SQL for a selected supported data source. Its documented interfaces include CLI, REST and Arrow, Python, and a native MCP server for agents. The Dosi documentation lists 16 SQL dialects as of October 2026.
That creates a different center of gravity from placing every definition inside one dashboard vendor’s stack. The model is a reviewable artifact, while the engine serves different kinds of consumers. An agent can ask for a named metric through MCP instead of trying to reconstruct its SQL from raw schema. An application can request results through the documented API and present them in its own interface. The semantic layer in the agent loop shows why this matters when the question changes during an investigation.
The boundary is important. Dosi does not automatically make every BI tool interpret a metric identically. Each integration should be checked for totals, filters, access, and latency. Supporting multiple data sources also does not imply automatic joins between separate warehouses. Dosi pushes a query to the selected source; teams still own the mappings and the quality of their models.
Apache Ossie is open; Dosi itself is source-available under Elastic License 2.0. The Datus agent is open-source. Those are distinct parts of the approach, and portability should be tested for the specific model features and consumers your team intends to use.
This is especially relevant when one consumer is an agent. An agent can choose a metric and a breakdown, but it should not quietly invent a different revenue definition when its first request fails. Clear metric names, documented dimensions, and structured errors give it a path to ask for the right thing or explain what cannot be answered. The user still needs to see the period, filters, and source behind the response. An answer that sounds plausible but hides those choices is no more reliable because it came through a semantic API.
A practical test before you adopt it
Start with one metric and two real consumers. For instance, use net revenue in a dashboard and an internal app, or in a dashboard and an agent. Ask the business owner to approve the definition and the expected result for a small set of cases.
Check the ordinary case first, then the cases that expose hidden differences: a refund, an empty month, a ratio subtotal, a user with restricted access, and a metric definition change. Make each consumer show the same dates and filters beside its answer. Record where the numbers diverge and whether the fix belongs in the source data, the semantic model, or the interface.
Finally, measure the experience, not only the result. If users have to wait too long for a chart or cannot understand an error, shared definitions alone have not improved their workflow. A successful pilot gives you a repeatable way to add a third consumer; an unsuccessful one tells you exactly where the boundary is.
Assign the test to people on both sides of the boundary. A data owner checks that the definition matches the business decision. An engineer checks how the query resolves against the source. Someone who works in the consuming application checks whether its filters, totals, and access behavior make sense. Record the expected answer and the displayed answer side by side. That small habit makes future changes safer than relying on screenshots from a one-time demo.
Conclusion
Headless BI is useful when the same business metric must serve more than one kind of interface. Its promise is a shared definition, not a replacement for dashboards or a universal connector. The strongest implementation keeps the model reviewable, tests the last mile in each consumer, and gives someone clear ownership of the result.
Frequently asked questions
Is headless BI the same as a semantic layer?
Not exactly. A semantic layer defines business concepts and makes them queryable. Headless BI is a way to use that layer without requiring one particular dashboard interface. A semantic layer can be embedded in a BI tool, exposed to other consumers, or both.
Does headless BI replace dashboards?
No. Dashboards still help people monitor and explore data visually. Headless BI separates shared definitions from presentation, so a dashboard can be one consumer alongside an app or agent. The interfaces still need design, access checks, and testing.
Will every BI tool show the same metric result?
Only if the integration preserves the calculation and filters. Some tools apply their own aggregation or model on top of a result. Test ratios, subtotals, missing periods, and permissions in the final display rather than assuming an API connection is enough.
When is headless BI worth the extra work?
It is most useful when two or more real consumers repeatedly need the same governed metrics and currently duplicate the logic. If one BI environment already meets the team’s needs, a new service may add more work than it removes. Pilot one metric across two consumers before deciding.
Can a headless layer query multiple data sources?
That depends on the engine. Dosi can compile Apache Ossie models to SQL for multiple supported dialects, but a request targets a selected data source. This is different from promising automatic joins across separate warehouses. Check each source mapping and the consistency of the resulting metrics.
Related articles
- What is a semantic layer? — the business definitions underneath headless BI
- What is a semantic model? — the model that expresses metrics and relationships
- What is conversational BI? — one interface for asking questions about shared metrics
- The semantic layer in the agent loop — how an agent uses definitions during exploration