
AI Analytics ROI: How to Measure Value Beyond Speed
Learn how to measure AI analytics ROI with a worked example, costs and pilot metrics. See how Datus helps teams check answers using shared business definitions.
TL;DR
Measure AI analytics ROI from the cost of reaching a usable answer, including verification and rework. Compare equivalent tasks, value the benefits you can demonstrate, and include setup and operating costs. Shared definitions can reduce repeated checking; measure that benefit in your own pilot.
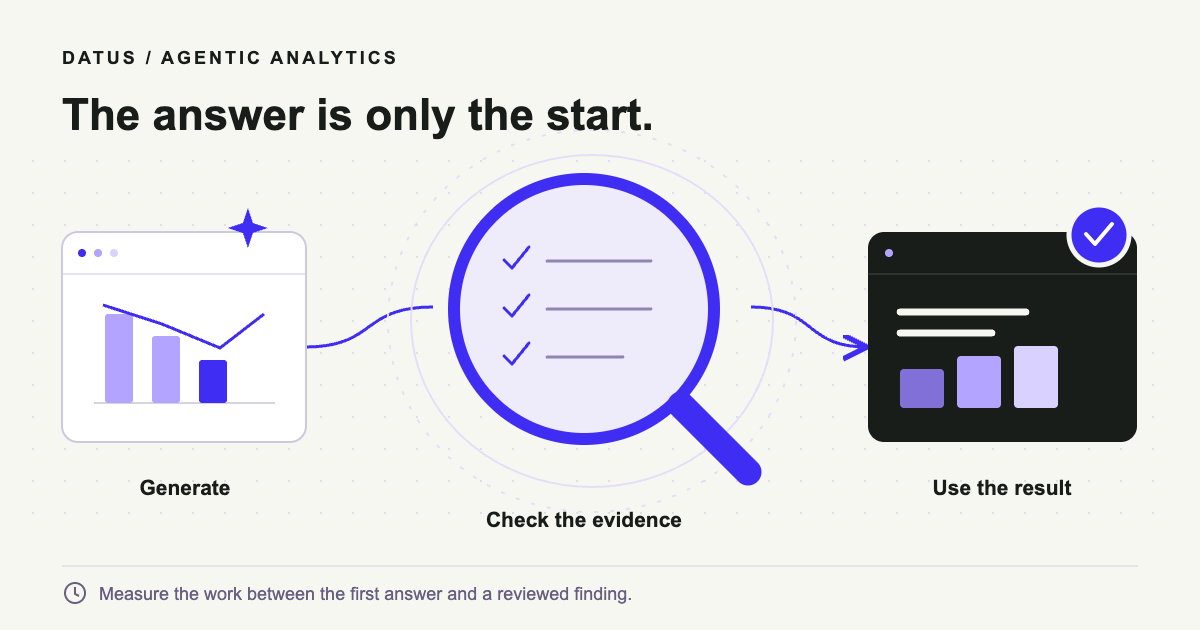
The answer arrived. The work is not finished.
An AI assistant produces a chart and explains why sales fell. You now have a result to inspect. Which sales definition did it use? Were both weeks complete? Does the evidence support the explanation? Those checks determine whether a quick answer actually saves work.
In a Reddit discussion about AI product analytics, u/Expert-Activity-8614 put it plainly: “if a finding saves me ten mins and takes twenty to verify that’s not a win.” This is an individual’s experience, not an industry benchmark. Replies favored claims that could be checked with a query and findings that guide an investigation before prompting an action.
The evaluation question is therefore bigger than answer speed: how much work does the team need to reach a result it can use? This guide turns that question into an ROI calculation, a measurement plan and a concrete example of where Datus can help.
How do you calculate AI analytics ROI?
AI analytics ROI is the financial return from an AI-assisted analytical workflow relative to its incremental cost. Measure it over a defined period, against the existing workflow and the same quality standard. Include the effort to check and correct answers, alongside setup, software, model usage, warehouse queries and maintenance.
For a simple, undiscounted business case, use:
ROI (%) = (attributable benefit − incremental cost) ÷ incremental cost × 100.
Use the same period and currency for benefits and costs. When incremental cost is zero, this ratio is undefined; report the benefits and costs separately.
For an analytics productivity pilot, establish the labor difference first:
Human effort saved = baseline hands-on time − assisted hands-on time.
Include clarification, analysis, verification and rework on both sides, across everyone involved.
A useful answer must meet conditions agreed before the trial. For a sales investigation, these might include the intended sales definition, comparable periods, a reconciled breakdown and a clear distinction between an observed change and its possible cause. A fast chart that misses these conditions is unfinished work. Keep its cost in the trial rather than dropping the unsuccessful attempt.
Separate capacity from cash savings
Hours freed up can help a team investigate more questions or reduce a backlog. They do not automatically reduce payroll. If you value those hours at a labor rate, label the result as capacity value and explain how the team expects to use it. A cash-savings claim needs evidence that a cost actually fell. Count extra revenue only when there is a defensible link to the intervention; a generated recommendation alone provides none.
Include the costs that make the workflow usable
Setup includes connecting data, reviewing metric definitions, preparing evaluation questions and training users. Recurring costs include subscriptions, model calls, warehouse execution, support and definition maintenance. Include extra specialist review when business users need help checking an answer. Keep setup visible in the first-period calculation rather than spreading it across hypothetical future usage.
Avoid double counting. If the labor benefit already subtracts assisted verification time from baseline time, do not charge those same review minutes again as an additional operating cost. Likewise, do not count both the value of freed hours and the revenue produced with those same hours without explaining how the benefits are distinct.
A worked example: when faster answers do not pay back yet
Consider an illustrative team completing 100 comparable analytical tasks per month. These are invented inputs for explaining the calculation, not Datus performance results. Assume every task eventually meets the same acceptance standard, and the timing includes all attempts and rework.
| Monthly measurement | Existing workflow | Assisted workflow |
|---|---|---|
| Accepted analytical tasks | 100 | 100 |
| Hands-on minutes per task, including checks | 30 | 18 |
| Total human effort | 50 hours | 30 hours |
| Freed capacity | — | 20 hours |
At an assumed labor rate of $60 per hour, the 20 hours represent $1,200 in monthly capacity value. Suppose incremental recurring costs are $400 per month and initial setup costs $2,000. Review effort is already included in the 18 minutes, so it is not added again to the $400.
For the first month, the modeled return is ($1,200 − $2,400) ÷ $2,400 = −50%. Across three identical months, it becomes ($3,600 − $3,200) ÷ $3,200 = 12.5%. The recurring $800 monthly surplus would cover the $2,000 setup cost after 2.5 months, under these assumptions. These are capacity-based estimates; they are not evidence of cash savings or improved business decisions.
Now change one input. If hidden verification and rework raise assisted effort to 27 minutes per task, the team frees only five hours, worth $300 at the assumed rate. That does not cover the $400 recurring cost, before setup. The software may still generate its first answer quickly. The complete workflow has a different economic result.
This is why the checking work belongs inside the calculation. Use your own task mix, costs and observed quality; the example’s value is showing which assumptions can change the conclusion.
Which metrics should an AI analytics pilot track?
Track effort, delivery time, quality and cost together. Each answers a different question; no single measure shows whether the assistant has improved the whole workflow.
| Metric | How to measure it | What it tells you |
|---|---|---|
| Human effort per task | Sum all participants’ clarification, analysis, verification and rework minutes | Whether work fell or moved to another person |
| Time to a usable answer | Elapsed time from request to accepted outcome | Whether decisions can happen sooner |
| Accepted-task rate | Tasks meeting the agreed standard ÷ all attempted tasks | Whether the workflow completes the intended work |
| Verification and rework burden | Review minutes, correction minutes and reasons | Where effort remains and what should improve |
| Later-correction rate | Accepted answers subsequently corrected ÷ accepted answers, over a stated follow-up window | Whether initial review missed problems |
| Cost per accepted outcome | Total allocated delivery cost, including failed attempts, ÷ accepted outcomes | Whether reliable delivery becomes more economical |
For cost per accepted outcome, include the full delivery cost of each workflow: human effort, allocated tools and infrastructure, and the cost of unsuccessful attempts. This measure differs from the ROI formula, which uses incremental cost and benefit relative to the baseline. If a pilot produces no accepted outcomes, report zero accepted outcomes and the total spent; do not assign a cost per success.
State how shared costs are allocated. A warehouse or platform may serve many teams, so charging its entire bill to one pilot would distort the comparison. A task-based allocation can work if the usage records support it. Keep the allocation method consistent between periods, and show both observed recurring cost and the setup cost assigned to the evaluation. This lets a reader reproduce the calculation instead of trusting an unexplained headline percentage.
Elapsed time and hands-on time are different. A warehouse query can run while an analyst works elsewhere; waiting for an owner to clarify a definition can delay delivery without consuming much labor. Keep both measures rather than treating every minute on the clock as a minute saved from someone’s workload.
Acceptance also depends on the decision. Identifying a region worth investigating may satisfy one task. Recommending a pricing change requires stronger evidence. A high acceptance rate means little if the team quietly lowers that bar. Check a sample independently and use a fixed follow-up window for later corrections, so newer answers do not appear safer simply because nobody has had time to challenge them.
What makes an AI answer expensive to verify?
Suppose Northstar, our fictional retailer, asks: “Why did net sales fall last week?” The example below illustrates a review process; it is not a timed product test or a result from the downloadable Northstar dataset.
The first check is whether the decline is real. “Last week” needs an explicit calendar and time zone, and the underlying data must cover the complete period. If Sunday orders have not arrived yet, a comparison with the previous full week is premature. An agent can calculate precisely from incomplete data, so checking coverage should happen before debating the explanation.
Next comes the meaning of sales. For this example, the team intends merchandise sales after refunds, excluding cancelled orders. It must also decide how refunds relate to time: a refund recorded this week and a refund assigned back to the original order week answer different business questions. A query can execute successfully under either convention. The reviewer needs the convention that applies to this decision.
Then the team checks the breakdown. Perhaps the decline is concentrated in one region or product category. That result helps focus the investigation, provided the breakdown preserves the original population, time window and metric definition. If the follow-up silently switches from net sales to order amount, the two charts no longer describe the same change.
Finally, there is the proposed cause. A decline concentrated among mobile shoppers does not establish that a checkout change caused it. Traffic mix, product availability, missing events and campaign changes are possible alternatives. The team may have enough evidence to investigate mobile checkout while still lacking enough evidence to roll back a release. Those are different conclusions with different review requirements.
| Review question | Evidence to inspect | What the check establishes |
|---|---|---|
| Are the periods comparable? | Date boundaries, time zone and source coverage | Whether the comparison is meaningful |
| Is this the intended metric? | Formula, refund convention, exclusions and population | Whether the calculation answers the business question |
| Does the breakdown explain the measured movement? | Grouped results that reconcile with the total | Where the change is concentrated |
| Does the explanation justify an action? | Operational evidence, alternative explanations and, where needed, an experiment | Whether to investigate further or act |
The research helps explain why these checks need more than a polished explanation. In How Do Analysts Understand and Verify AI-Assisted Data Analyses?, researchers observed analysts moving between analysis procedures and data artifacts to check results. A separate position paper on verification cost argues that evaluation should consider whether people can detect errors within a realistic checking budget. It offers an evaluation perspective, not a universal productivity benchmark.
This sequence helps locate the expensive part of verification. If reviewers repeatedly hunt for the metric definition, the problem is access to shared context. If the definition is clear but data arrives late, the work belongs with the pipeline owner. If the arithmetic checks out but the explanation is speculative, additional SQL alone may not settle the question. Recording the reason for rework makes the pilot useful even when the initial productivity result is disappointing.
How Datus can reduce repeated verification work
Datus brings business context and analytical work into the same workflow. Datus Agent can use existing knowledge to help develop semantic models and answer questions; DOSI executes compatible metric definitions against the connected data source. In Datus’s AI/BI workflow, the opportunity is to reuse reviewed calculation logic and make the basis of an answer easier to inspect.
For Northstar, that means the sales definition can exist before the next question arrives. The team still has to decide what net sales means. Once reviewed, the definition provides a stable basis for comparing weeks, regions and customer groups. The expected benefit is less repeated reconstruction of the calculation; the amount of time saved needs measurement in the team’s own workflow.
Reuse the calculation that the team has checked
Datus’s semantic-modeling workflow can build or update a model using database structures and supplied business logic. It validates the model and can compare requested outputs with reference results when those are available. A team can therefore start from an existing sales query, preserve its intended calculation, and examine where the resulting metric agrees or differs. The SQL-to-business-metrics walkthrough explains this process in more detail.
The distinction between a model check and a business check matters. The Agent’s verification implementation compares metric output with reference SQL using declared grouping keys and tolerances. It can report passed, failed or unverified. A matching result checks a particular comparison; it does not establish that the reference query encodes the right policy, covers every edge case, or proves a causal explanation. A business owner still needs to review the definition.
Make the question’s interpretation visible
For an existing metric, the Agent can retrieve its definition and query it through DOSI. The scoped AskMetrics workflow is designed to report the interpreted question, time range, metric names, result and relevant limitations. If no existing metric can answer the question, that workflow is instructed to say so rather than invent a substitute through raw SQL.
For the reviewer, this changes the task from guessing what the assistant meant to checking an explicit interpretation. Was the requested metric net sales? Was the region filter retained? Did the comparison use the intended periods? Making these choices visible gives the user specific places to correct the answer. It does not remove the possibility of a wrong metric selection or an overlooked business convention.
Keep deeper evidence available to the data team
The normal AskMetrics answer does not return raw SQL. Deeper inspection happens through the underlying model and engine evidence: DOSI’s query interfaces can expose compiled SQL, outputs and warnings, while its metric lineage connects metrics to datasets and physical sources. Business users and data specialists do not need identical review surfaces.
For a recurring sales question, a manager may only need the metric identity, scope and comparison. If a number looks wrong, the data team needs the calculation and source mapping. Keeping that route available can avoid recreating the analysis simply to understand it. As our data lineage guide explains, model dependencies are useful evidence, but they are not a complete record of source freshness or everything that happened in a particular run.
Keep the conclusion within the evidence
DOSI provides metric attribution to investigate where a change is concentrated. That can support Northstar’s next question, such as which region contributed to the decline. The Agent’s attribution instructions explicitly treat this as descriptive decomposition, not proof of causation. Showing the affected segment is a useful result even when the reason behind the change remains open.
For an action such as changing prices or rolling back checkout, the responsible person needs additional evidence. This boundary makes the output more useful: the team can accept the measured finding, identify what is still unknown, and assign the next investigation. The agent does not need to fill every gap with an explanation for the work to have value.

How do you decide whether to expand the pilot?
Start with a recurring question and compare the assisted workflow with the best existing route. If a reviewed dashboard already answers Northstar’s weekly sales question, opening it belongs in the baseline. The agent may add most value in the follow-up investigation. Measure that incremental work instead of assuming every question currently requires a new SQL query.
Set the baseline and acceptance conditions
Choose representative questions before running the comparison. Separate KPI lookups, investigations and recommendations, since they require different evidence. Keep data availability, metric definitions and permissions comparable. A regional manager and a company-wide analyst may legitimately get different totals; that difference should not be scored as an accuracy failure.
For each task, record the question, definition revision, data snapshot and permitted scope alongside the finish line. Include ambiguous requests and unsuccessful attempts. Comparing a routine baseline lookup with an unusually difficult assisted investigation would tell you little about the tool’s effect. Where possible, vary which workflow reviewers use first so familiarity with the answer does not favor one approach.
Record effort as the work happens
Use the pilot worksheet to capture clarification, analysis, verification, rework, elapsed time, outcome and operating costs. It contains blank baseline and assisted rows, with no assumed performance. Record each person’s effort when it occurs; estimates of how long a task “usually takes” make a weaker comparison.
Keep rework attached to the original question. If the agent chooses order amount instead of net sales, a successful second answer should not erase the first attempt. Record the reason for correction too. Repeated metric confusion suggests a different fix from incomplete source data or unsupported causal claims. A shorter review that overlooks more errors is not an improvement under the same quality standard.
Decide what the results justify
Expand a task type when it reaches the agreed quality standard with lower complete delivery cost or a clearly valued service improvement. Narrow the scope when routine lookups help but causal recommendations remain expensive to review. Pause expansion when later corrections rise, reviewers cannot inspect the evidence, or recurring costs exceed the benefit you can justify. Set these decision rules before seeing the results; there is no universal acceptance-rate target for every business decision.
Revisit the calculation when usage or definitions change. A sales model reused across frequent questions has a different payoff from one built for an isolated request. If the business changes its refund policy, include the review and regression work in ongoing maintenance. Reuse creates value only while the shared definition remains suitable for the questions being asked.
Make the next answer cheaper to check
The most useful outcome of the pilot is knowing which checks keep recurring. A missing refund convention should lead to a clearer shared definition. A repeated mismatch should lead to a corrected calculation and a regression check. A speculative explanation should lead to a narrower conclusion or a better investigation.
That is the opportunity for context-backed analytics: each reviewed definition can support future questions, while the reviewer concentrates on what changed. Start with one recurring question in Datus Studio, agree what would make its answer usable, and measure the entire path to that point. A faster first answer is encouraging. Less effort to reach a result the team can use is the outcome to demonstrate.
Frequently asked questions
How do you calculate AI analytics ROI?
Subtract incremental cost from attributable benefit, divide by incremental cost, and multiply by 100. Use the same period for both. For productivity benefits, measure the difference in complete human effort, including verification and rework, before applying a defensible value to the hours saved.
Which costs belong in an AI analytics business case?
Include setup, integration, metric review, training, subscriptions, model usage, warehouse queries, support and maintenance. Count specialist review across all teams. If review time is already deducted from the labor benefit, do not charge that same time again as an additional cost.
Does time saved count as financial ROI?
It can support a capacity-based business case, but it does not automatically become cash savings. State the labor-rate assumption and how freed capacity will be used. Report actual cost reductions and attributable business outcomes separately, without counting the same benefit twice.
Does a semantic layer remove the need to verify AI answers?
A semantic layer reuses a defined calculation. Reviewers still need to check the selected metric, period, population, source completeness and proposed explanation. Shared definitions make review more focused; they do not guarantee that every answer is correct.
Can Datus show the evidence behind an answer?
AskMetrics is designed to state the metric, interpreted question, time range and result. DOSI’s underlying interfaces provide compiled SQL and model lineage for deeper inspection. The ordinary AskMetrics response does not itself return raw SQL, and model lineage does not prove source freshness.