
Data Lineage for AI Analytics: From Answers to Sources
Trace AI analytics answers back to metric definitions, source fields, and query context. See how Datus makes semantic model lineage available for review.
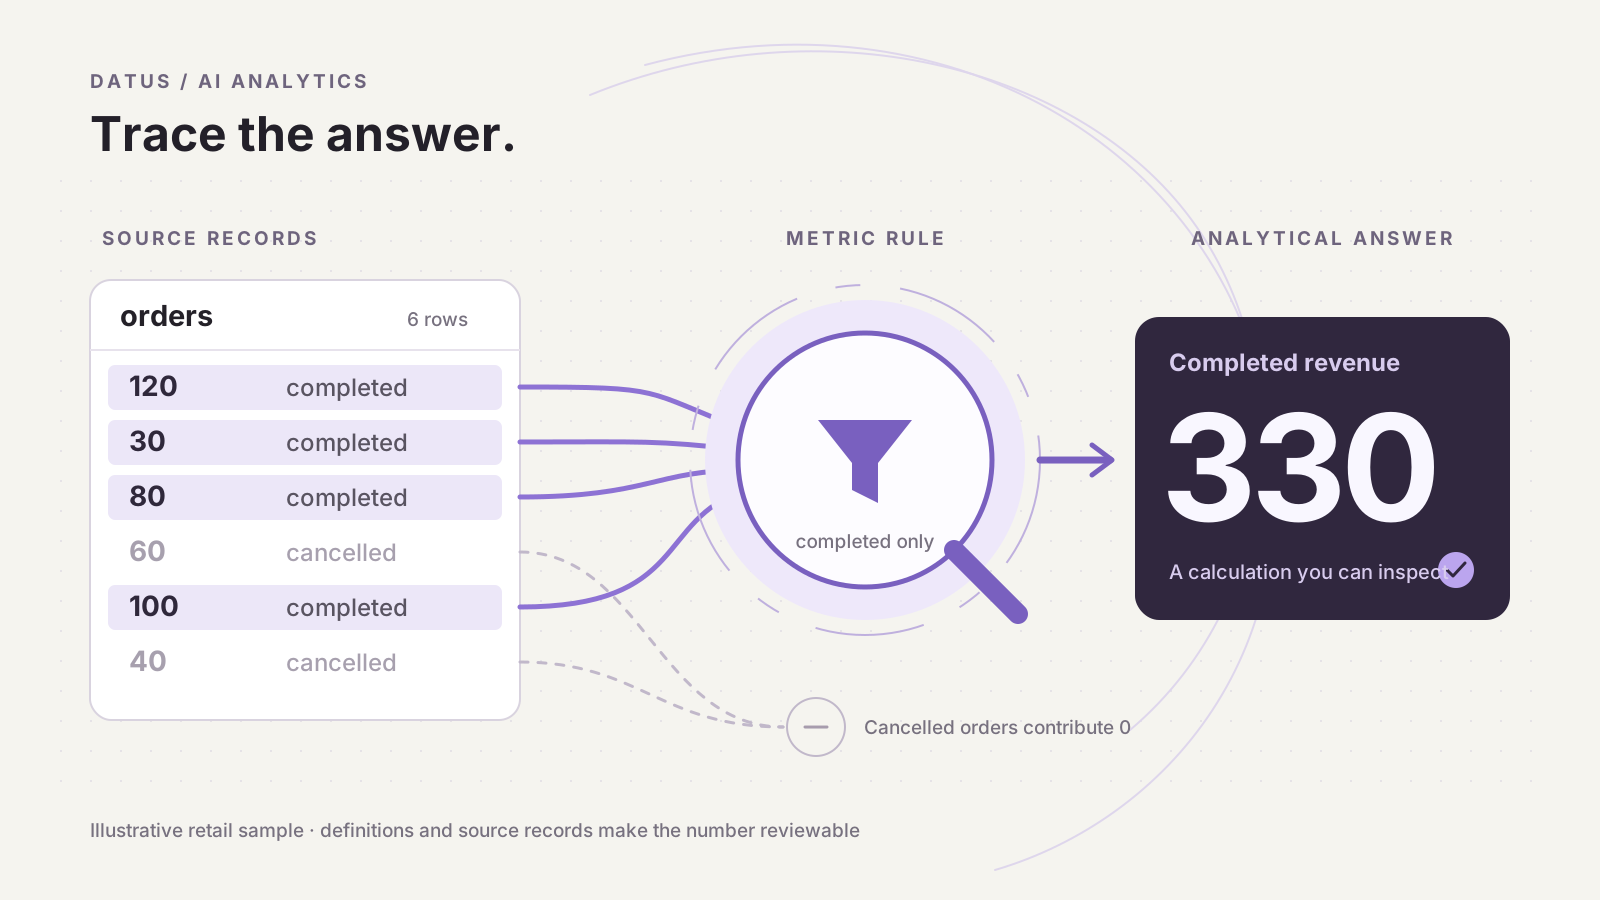
TL;DR
Data lineage helps connect an AI answer to the data and calculations behind it. For analytics, review the metric definition, its source dependencies, and the actual query context together. Datus exposes semantic model lineage; a complete investigation also needs evidence about the query and source data.
A number is easier to trust when you can follow it
An analyst asks an AI agent, “How much completed revenue did we make?” The answer is 330. Before using it in a report, the analyst needs to know what “completed” means, which orders were counted, and whether the question covered the intended period. A confident explanation from the agent does not supply those facts by itself.
Data lineage describes how data moves through sources and transformations to an output. In AI analytics, that output might be a number in a conversation, a chart, or a generated report. The useful question is concrete: can a reviewer follow this particular answer back to its calculation and source? A graph becomes valuable when it helps the reviewer answer that question.
The same revenue figure could come from an approved metric, an agent-written query, or a stale report copied into the conversation. Those routes require different evidence. Knowing which table exists is a starting point; knowing which definition and query produced the answer is what makes the result reviewable.
Three kinds of evidence behind an AI answer
A reviewable analytics answer brings together data dependencies, business meaning, and execution context. Each explains a different part of the result. A pipeline graph can show how a table was populated, while a semantic model explains a revenue calculation and a query record identifies what actually ran.
| Evidence | Question it answers | Example |
|---|---|---|
| Pipeline and source lineage | Where did these records come from? | An ingestion job loads order events into the warehouse. |
| Semantic model lineage | What data and definitions does this metric depend on? | Completed revenue reads order amount and status from the orders dataset. |
| Query context and result | What produced this particular answer? | The metric version, date range, grouping, generated SQL, and returned value. |
These distinctions also appear in existing standards. OpenLineage describes jobs, runs, and input/output datasets, with metadata about what ran and what it used. A model dependency graph answers a related question about how a calculation is defined. Keeping both makes it possible to distinguish a change to the source pipeline from a change to the business formula.
A data catalog helps people find and understand assets. Lineage adds the relationships between them. Neither the presence of a catalog entry nor a connected graph proves that a particular answer used the right date range. That comes from the evidence attached to the executed query.
Follow 330 back to the source
Our working semantic model example includes six fictional orders. Four are completed and two are cancelled. The source amounts make it possible to check the answer without relying on the agent’s explanation.
| Order | Status | Amount | Included in completed revenue? |
|---|---|---|---|
| 1 | completed | 120 | Yes |
| 2 | completed | 30 | Yes |
| 3 | completed | 80 | Yes |
| 4 | cancelled | 60 | No |
| 5 | completed | 100 | Yes |
| 6 | cancelled | 40 | No |
Completed revenue is 120 + 30 + 80 + 100 = 330. Summing every order instead gives 430. Both calculations read the same table and amount column. The difference is the status rule, which determines which rows contribute to the metric. The downloadable sample SQL contains these exact rows; these figures are test data, not customer results.
That makes status part of the explanation even though it is not the value being summed. OpenLineage’s column lineage specification distinguishes direct value dependencies from indirect influences such as filters, joins, and grouping. A review that follows only the amount column misses the condition that changes this answer by 100.
The business definition needs review too. The sample retailer might recognize revenue when an order completes; another company might use payment or fulfillment. The lineage should let an analyst see the chosen rule. Whether that rule is appropriate belongs in the team’s business rule validation process.
How Datus makes the metric’s lineage visible
Datus combines an Agent that works with data and project context with DOSI, the semantic engine behind reusable metric definitions. The Agent can use a named metric when answering a business question. The team can then inspect the model behind that metric instead of reconstructing its meaning from a chat response. The Datus semantic layer solution describes this shared-definition approach.
Connect the metric to its dataset and source
Datus Studio’s Semantic Explorer presents the layers of a semantic model: physical tables, datasets, and metrics, including dependencies between derived metrics when the model declares them. For our completed-revenue example, the relevant path is main.orders → orders dataset → completed_revenue. The metric’s expression explains the completed-status condition; the dataset supplies the field mappings.
The illustration below follows the Studio lineage layout and uses the sample model. It shows a selected metric and the definition a reviewer would inspect. This is a simulated interface, not a screenshot of a live customer project. The cancelled rows remain in the source table; the metric expression decides whether their amounts contribute.
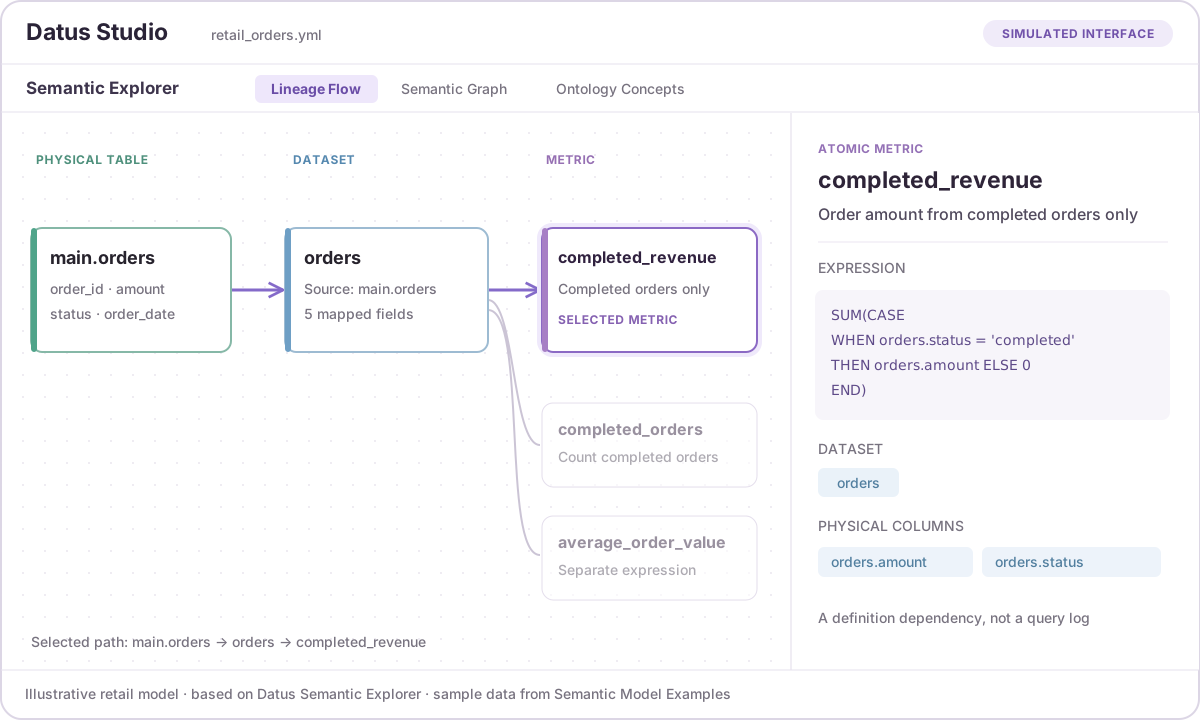
Open the lineage illustration at full size
DOSI’s metric lineage documentation describes the underlying model graph and its details, including source tables, field expressions, metric expressions, and physical columns. The graph is derived from the model. Its role is to expose dependencies; it does not, by itself, certify the warehouse contents or prove which query a conversation executed.
Match the definition to the actual answer
The next question is whether the answer used that definition under the intended conditions. In Datus Studio, a saved metric can be queried and its result inspected alongside generated SQL. For a review of an Agent answer, the metric identity and definition need to be matched with the query that produced the reported number. Similar names are not enough.
For the 330 example, the evidence should establish that the calculation used the sample orders across their full period, with no regional grouping and with the completed-order condition intact. If a later question asks for one month or one region, the same metric can legitimately return a different number. A review should preserve that context rather than treat every difference as a definition error.
Model lineage fits alongside the warehouse and pipeline evidence already available in a team’s stack. It provides a readable account of the metric’s dependencies within the semantic model. Upstream ingestion history and the record of an individual query remain additional parts of the investigation. A single graph should be interpreted according to the relationships it actually contains.
Use lineage when the answer or definition changes
Lineage helps narrow the investigation when two answers disagree. If one query returns 330 and another 430, check whether they used the same metric and population before investigating the ingestion pipeline. If the formula agrees but a source amount changed, inspect the underlying records and their loading history. This lets the reviewer separate a definition difference from a source-data difference.
The same approach supports change review. Suppose a team changes completed revenue to use payment status instead of order status. The source table might stay the same, so the graph’s overall shape may look unchanged. The expression and its meaning have still changed. Retaining the definition version and reviewing dependent metrics matters even when no new box appears on the graph.
Grouping and filters need similar care. A regional answer can depend on a customer relationship that a company-wide total does not need. An amount column may have direct calculation dependencies, while region affects how the result is grouped. Review the relevant query as well as the graph; a list of direct metric references is not a complete inventory of every possible filtering or grouping use.
What to keep with a result you plan to share
A useful handoff lets another person identify the definition, reproduce the query scope, and inspect the underlying dependencies. For a reported metric, keep the metric name and model version, the period and filters, the grouping, the executed SQL or query identifier, and the returned result together. Record where the model came from and when the query ran.
This is a review practice, not a claim that every product automatically packages those items. A team should check what its tools retain and supply anything missing. A readable SQL statement can explain the calculation while still leaving a question about freshness, access scope, or the reference definition. The row-level security guide explains the separate issue of which records the caller may read.
Conclusion
For AI analytics, data lineage becomes useful when a reviewer can move from an answer to a named calculation and its source dependencies. Datus makes that semantic model visible. Pairing it with the actual query context and source evidence gives a team a practical way to investigate a number, explain a change, and decide whether a result is ready to share.
Frequently asked questions
What is data lineage for AI analytics?
Data lineage for AI analytics describes the sources and transformations behind an analytical answer. A useful review also identifies the business metric definition and the query context, such as the period, grouping, and filters. Together, these let someone investigate where the number came from and whether it answers the intended question.
Is generated SQL enough to explain an AI answer?
SQL shows how the query calculates a result, but it may not explain why that definition was chosen or which model version it represents. Review the named metric, its meaning, and its source dependencies alongside the executed query. Source freshness and the caller’s permitted data scope can also affect the answer.
Does a lineage graph prove that a metric is correct?
A lineage graph exposes dependencies; correctness still requires checking the definition and results. A graph can faithfully represent an expression that includes cancelled orders even when the business wanted completed orders only. The reviewer needs an agreed definition and an independent way to check that the calculation applies it.
What lineage can Datus show?
Datus Studio’s Semantic Explorer shows semantic model dependencies across physical tables, datasets, and metrics. DOSI supplies the model graph and details such as expressions and source fields. This is model-level evidence. It should be paired with the actual query record and upstream pipeline information when reviewing a complete analytical answer.