
Agentic Analytics Platforms Compared: What to Evaluate
Compare agentic analytics platforms on shared definitions, access control, analysis outputs, and deployment. Use a practical evaluation before choosing a tool.
TL;DR
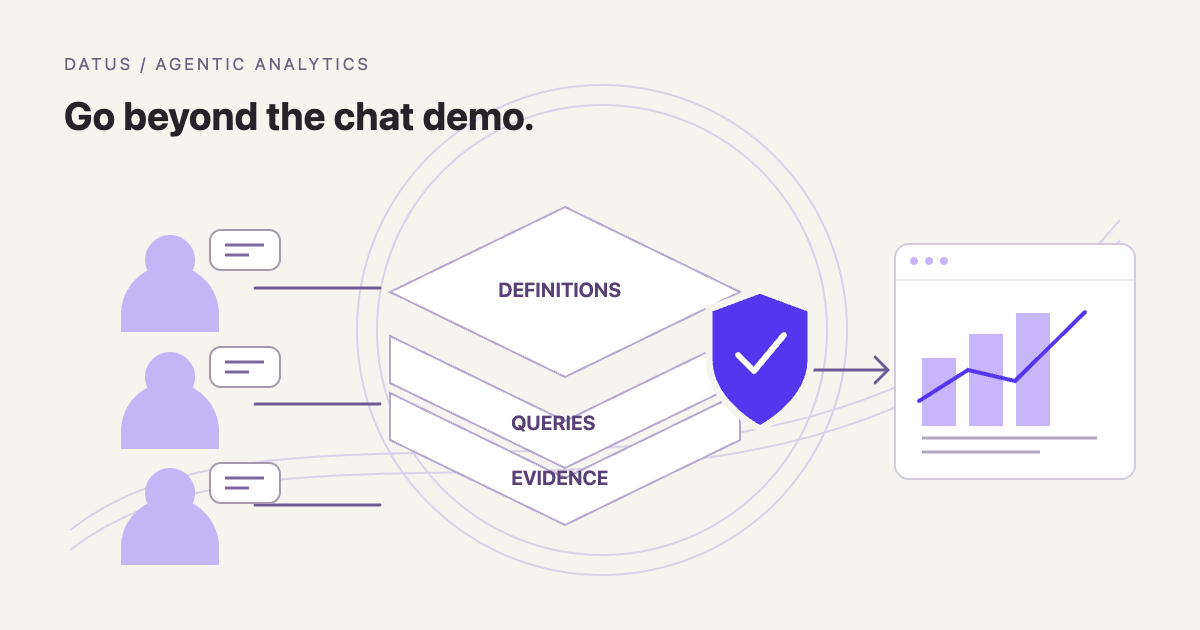
Compare agentic analytics platforms by the definitions they use, the permissions they enforce, and the evidence that survives when an answer becomes a report. Test the same business question across users and outputs before choosing a tool. A fluent conversation is the beginning of the evaluation.
What is an agentic analytics platform?
An agentic analytics platform combines an AI agent with data access, business context, and analytical tools. The agent can interpret a question, plan an investigation, run queries, inspect results, and choose a follow-up step. The platform also provides ways for people to review the work and use its outputs, such as conversations, dashboards, or reports.
A business user asks, “Why did net sales fall last week?” The first answer looks useful: a chart, a regional breakdown, and a short explanation. Then finance asks whether refunds are included. A regional manager opens the shared link and asks why another region is visible. The analyst who built the original calculation wants to see which definition the agent used.
These follow-up questions reveal more than the first chart. They connect the conversational experience to the responsibilities your team already carries: metric ownership, query access, source quality, and reporting. A platform can make exploration easier while still requiring work in each of those areas. The purchasing decision should expose that work before a successful demo turns into an operating commitment.
This guide compares Datus, Cube, Hex, Sigma, and ThoughtSpot through those responsibilities. It focuses on business-data analysis over connected sources, rather than general-purpose agent builders or event-tracking products. For more on the category, see what agentic analytics means. This guide explains the platform architecture, the market, the implementation work, and what to evaluate before choosing software.
Core Architecture & Components
An agentic analytics platform connects a user’s question to an analytical workflow, with business context and access controls around the execution. The agent decides what to investigate; tools carry out the queries and calculations. Results return to the agent, which can inspect them, ask for clarification, or continue the investigation. People remain responsible for approving business meaning and deciding whether the evidence supports an action.
A typical workflow is question → plan → retrieve context → query → inspect results → answer or investigate further. A finding can lead back to an earlier step: a sales decline may prompt a regional comparison, followed by a check of refunds or data completeness. This feedback within an investigation differs from maintaining the shared definitions that later investigations reuse. Both loops need a clear place in the architecture.

| Component | What it does | Example in a sales investigation |
|---|---|---|
| User interface | Receives questions, clarifications, and review feedback | A manager asks why sales fell and confirms the reporting period. |
| Agent and analytical tools | Plan work, request queries, inspect results, and choose follow-up steps | The agent compares regions, then checks the refund pattern. |
| Business context and semantic models | Describe concepts, metrics, relationships, and relevant source knowledge | Net sales has an agreed refund treatment, grain, and calendar. |
| Query and data services | Execute supported calculations over connected sources | The service queries orders, order lines, and eligible refunds. |
| Identity and policy enforcement | Determine which operations and data the requester may access | A regional manager receives results within their permitted scope. |
| Output and operations | Present, share, refresh, and retain evidence of the work | The team reviews an answer, publishes a dashboard, or distributes a dated report. |
These components can live in one product or span several services. An agent may use a warehouse’s semantic objects, a separate metrics engine, or models maintained inside a BI platform. A shared interface such as MCP can connect tools to an external agent, but the service behind the tool still owns its execution contract. During implementation, draw the actual connections rather than assuming that a single product name describes the entire system.
The distinction matters when a team adds a new interface. A metric can retain its definition while a new client introduces a different default date or display calculation. Likewise, an application can authenticate a user while a downstream service runs with a broader shared identity. A clear architecture makes those handoffs visible before the team relies on the output.
Notable Platforms in the Market
The table identifies five platforms with different starting points: a semantic service, an analytical workspace, a workbook environment, modeled conversational BI, and Agent-assisted data work. It does not rank response accuracy. The comparison reflects public product pages and documentation reviewed in November 2026; no cross-vendor benchmark was run. The same evaluation may produce different results under different plans, configurations, and source permissions.
| Platform | Documented starting point | Connection to business meaning | Main evaluation question |
|---|---|---|---|
| Cube | Semantic layer with agent and application interfaces | Metrics, dimensions, joins, and access rules | Does the required definition remain consistent across your actual consumers? |
| Hex | Conversational exploration connected to an analytical workspace | Semantic models, endorsed data, and workspace guidance | Can an analyst inspect and maintain the analysis a business user starts? |
| Sigma | Warehouse-connected workbooks and AI tools | Reusable data models and their permissions | Does the generated work fit your team’s workbook and release process? |
| ThoughtSpot | Conversational analysis over enabled models | Semantic models with model-level AI enablement | Do access and interpretation remain correct across the models users can query? |
| Datus + DOSI | Agent-assisted data work and reusable semantic definitions | Reviewed models over supported sources | Can your team build, review, and reuse the context across agent workflows? |
The meaningful comparison is between complete workflows. A conversational interface, a semantic engine, and a published reporting application are different components even when one platform packages them together. Ask which components are included in the proposed deployment. Then connect each promised result to the person responsible for keeping it working.
The user perspectives below come from public discussions, with links to the original accounts. Reddit identities and deployments are not independently verified; older comments describe the workflow at that time, rather than establishing the capabilities of a current release.
Cube: a semantic foundation for agents and applications
Cube’s AI context-layer page describes metrics, joins, business guidance, access rules, and external context, with MCP access for agents. It also describes evaluation cases that pair questions with expected answers. Its starting point gives the trial a concrete modeling artifact to inspect. A useful strength to examine is how a maintained semantic model serves multiple analytical consumers.
User perspective. In an older Reddit deployment account, u/chaos87johnito described serving business users through a React dashboard backed by Cube. They valued the range of requests it supported while noting that complex models required data-engineering time. This is a self-reported semantic-layer deployment, not a review of Cube’s current AI features. It makes model-authoring and maintenance effort a useful trial question.
Hex: conversational exploration in an analytical workspace
Hex’s Threads documentation describes conversational work over semantic models and warehouse tables, with expandable tool calls and results including tables and visualizations. Governed mode can restrict the sources agents use. Threads also has sharing requirements tied to the underlying data connections. These controls make the handoff between a business user and an analytical workspace an important part of the evaluation.
User perspectives. In a January 2026 discussion, u/nonobility86 reported using Hex and praised Threads for exploratory analysis. Another evaluator, u/clr0101, described a more technical, notebook-oriented experience and less success with their agent setup. These contrasting accounts do not establish present-day product performance. They suggest testing the handoff between a business question and the analyst who will inspect or extend the work.
Sigma: warehouse-connected workbooks and AI tools
Sigma documents reusable data models that can supply workbooks and other models, including relationships and metrics. Its AI toolkit page describes governed-model access through MCP and AI-assisted creation of workbooks. That makes the relationship between an AI request and a maintained workbook a useful comparison point.
User perspectives. In the same product-evaluation discussion, u/fleetswealth highlighted Sigma’s actions and input tables as useful for data applications. A separate 2024 onboarding discussion shows another side: u/RevDrMaux was comfortable with spreadsheets but still wanted help learning the reporting workflow. The older account is about onboarding, not current AI quality. Together, the comments make a case for trying a real workbook task with the people who will build and consume it.
ThoughtSpot: conversational analysis over modeled data
ThoughtSpot’s Spotter documentation describes instance, model, and user enablement. Its data-handling guide states that row- and column-level rules apply to the data Spotter can access. These are documented controls to verify in the proposed setup, rather than an independent security-test result.
User perspective. In a Reddit discussion about deploying conversational analytics, u/spooky_cabbage_5 described a ThoughtSpot-centered team whose users valued self-service and sharing findings. The same account described a small analytics-engineering team with a backlog of modeling requests. This is one organization’s experience, not a measure of Spotter accuracy. It highlights a practical question: how much of the business’s question space has the team modeled, and who expands that coverage?
Datus + DOSI: build reusable context around the data work
Datus is an open-source data engineering agent; Datus Studio provides a workspace for Agent-assisted work. Its semantic-modeling workflow helps turn physical structures and business definitions into reusable models. DOSI executes compatible Apache Ossie semantic definitions. The AI/BI solution illustrates how reviewed definitions can support exploration, metric monitoring, and reports.
The comparison point is the work needed to establish that context. If net sales exists in a trusted SQL query and a finance document, start there. Have the team review the resulting metric and source mapping, then ask the business question through the model. This is a semantic-layer-first approach to making expert knowledge reusable. It keeps the definition visible as the analysis moves between interfaces.
DOSI’s documented agent interfaces include semantic discovery, query preview, and execution. That creates a path for supported external agents to consume the same definitions. It does not establish that every client applies identical prompts, permissions, or presentation logic. Test the actual clients your team uses, and distinguish semantic reuse from arbitrary cross-warehouse federation.
For deployment, separate the components. Datus Agent is open source under Apache-2.0; DOSI uses Elastic License 2.0; Apache Ossie is the open specification. A privately deployed Agent and a hosted Studio workspace are different operating choices. Review the model provider, data connection, and policy enforcement for the chosen setup. An open-source component alone does not establish where every part of an analysis runs.
Key Implementation Challenges
The implementation work centers on making business knowledge, access, and generated outputs dependable across repeated use. A successful first conversation can hide gaps that appear when another user asks a related question or opens a shared result. Teams need owners for the definitions and services behind the interface. Those responsibilities should appear in the implementation plan alongside model and warehouse configuration.
Building context that covers real questions
A warehouse schema tells the agent what tables exist, but a business question also needs definitions, relationships, time rules, and exceptions. The team must decide which source is authoritative when a document, saved query, and dashboard disagree. It also needs a way to handle questions outside the reviewed model. Expanding coverage takes business input as well as engineering work; adding a conversational interface does not approve the missing definitions.
Carrying identity through every data path
User access must survive the handoffs between the application, agent tools, query service, and source system. A shared connection may need an additional policy layer to apply the caller’s permitted scope. Sharing creates a second question: whether the recipient sees a saved copy or requests fresh data under their own identity. Document both paths so that dashboard convenience does not obscure who is entitled to the data.
Making generated work maintainable
An exploratory chart can become a recurring report before anyone assigns it an owner. The team then needs to manage refresh, definition changes, review, and retirement. On LinkedIn, analytics consultant Tim Ngwena discussed walkthroughs of Sigma, Hex, and ThoughtSpot and observed that the tools follow different product philosophies. That is a useful evaluation lens: try the full working process, including how another person maintains what the agent creates.
Controlling cost and review effort
Agent calls, warehouse queries, recurring refreshes, and human verification all contribute to operating effort. A long investigation may request several intermediate results before producing an answer. A widely shared dashboard introduces a different usage pattern. Measure those paths separately in the trial, and include the time spent checking definitions and evidence rather than judging value by response speed alone.
What to evaluate
Evaluate the platform by tracing the same business question through definitions, access, evidence, and output. First establish a reference answer, then repeat the task across users and sharing methods. The checks below turn the architecture and implementation concerns into a trial your business owner, analyst, and IT team can review together.
Use one business question throughout the trial
A small, agreed example makes platform differences visible. Use an existing metric that finance and the data team can already reconcile, then ask for an explanation and a shareable output. The following fictional retail example is an evaluation design, not a report of measured vendor performance. Its purpose is to hold the task steady while the interfaces change.
Suppose your warehouse contains orders, order lines, refunds, and customer regions. Finance defines net sales as fulfilled line value after discounts, less eligible refunds. For this trial, refunds belong to the original order’s reporting period. Finance also specifies the timezone, the week boundary, and the treatment of cancelled orders. Those choices matter because another perfectly reasonable definition could book refunds in the period they were issued.
Ask every candidate platform the same question:
Why did net sales fall last week? Compare the completed weeks, show the regional breakdown I am allowed to see, and explain which definition and data support the answer.
Use the same frozen source extract for the first comparison. Include a refunded order, an order with several lines, and a transaction near the reporting-week boundary. Keep a trusted reference calculation beside the source data. The agent should help investigate the change, but the evaluation should not depend on accepting its first explanation as the expected answer.
Check the calculation before the explanation
A correct regional total requires more than valid SQL. Joining order lines directly to several refund events can multiply the line value. Filtering only the order date can omit a late refund that belongs in the agreed reporting period. An answer can sound sensible while either mistake changes the baseline. Ask the platform to expose the selected metric and query evidence before it explains the business movement.
A regional contribution to a decline is also different from a business cause. If one region accounts for most of the change, the next question might concern product mix, a refund batch, incomplete data, or an actual demand shift. Require the answer to distinguish what the query demonstrates from what needs further investigation. That gives the reviewer a concrete way to judge the analysis beyond whether the chart looks plausible.
Repeat the task as a different user
Run the question as finance, then as a regional manager with a narrower scope. Keep the prompt unchanged. The regional manager’s request should reach the data service with the intended identity and policy, and the returned rows should match that scope. A user saying “show all regions” should not expand the permissions attached to the session.
Next, share the resulting analysis through the actual mechanism your users will use. Open the link as its recipient, and examine exports separately. A result visible in a conversation may be copied into a static file or re-queried by a live application. Those two cases need different checks. The platform’s query permissions do not establish who may receive a previously generated file.
Change one approved definition
After establishing the baseline, revise one rule with the metric owner. For example, change which refund status qualifies, keeping a record of the previous rule. Ask the original question again and reopen the saved output. Check whether the report remains a labeled snapshot, refreshes under the revised rule, or needs an explicit update. Any of those behaviors can be appropriate when the team knows which one it bought.
Four boundaries to inspect
The evaluation should trace a result through definitions, access, evidence, and output. These boundaries exist regardless of whether a vendor calls its product a copilot, agent, or AI analyst. They give procurement and engineering a shared vocabulary for reviewing the trial. They also prevent a strong feature in one area from standing in for proof of another.
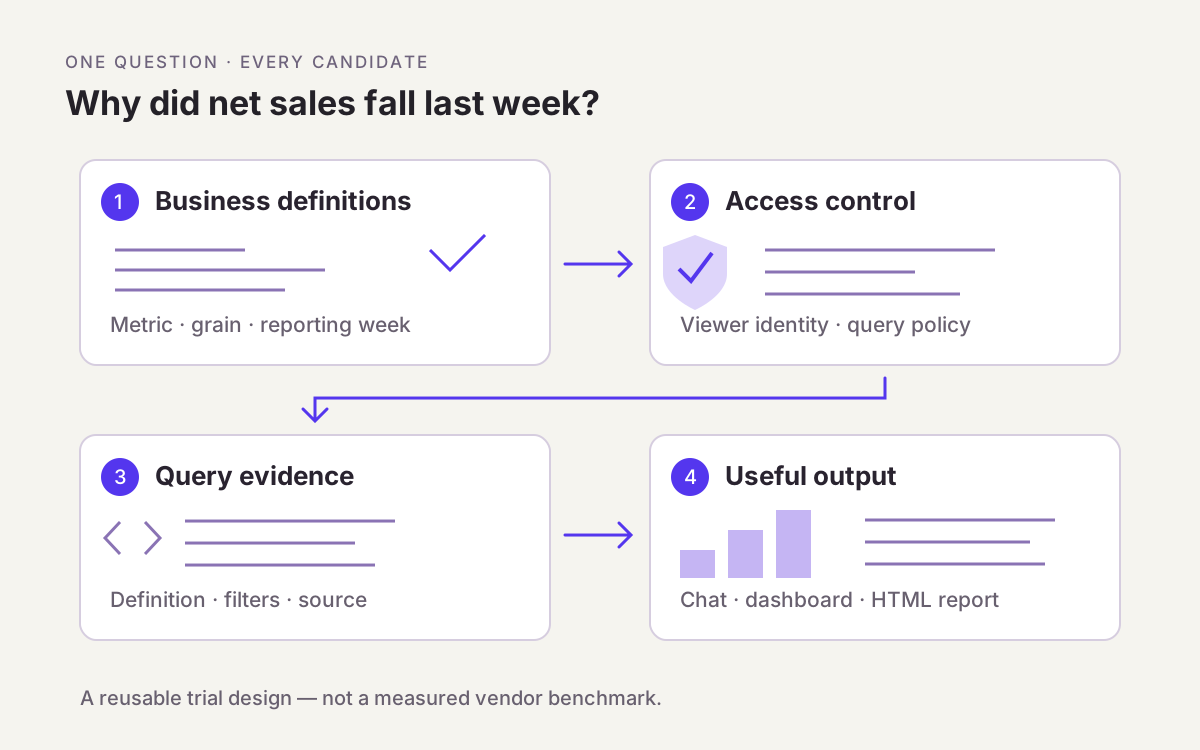
Definitions: what does the agent treat as authoritative?
Ask where the net-sales definition lives and how the agent finds it. A formula inside a workbook, a semantic-model measure, a saved reference query, and a note in a prompt can all influence an answer. They differ in who can inspect them and how other consumers reuse them. Locate the artifact that resolves a disagreement between the old report and the new conversation.
Then introduce a conflicting instruction, such as a historical document that uses gross sales under the label “sales.” The useful question is how the platform handles that conflict. Does it use the approved metric, ask for clarification, or select another source? Review the actual behavior and the available controls. A document being frequently retrieved does not make its definition the one finance has approved.
Access: which service enforces the user’s scope?
Permissions belong in an enforced query path. An instruction telling an agent to hide another region is different from a backend policy that prevents those rows from being returned. Ask the implementation team to trace the viewer’s identity through the application, agent tool, semantic service, and warehouse connection. If one of those steps uses a shared account, determine where the per-user restriction is applied.
Check totals, detail views, follow-up questions, and downloaded data. A region filter on the initial chart does not establish the behavior of a later drill-down. Column restrictions need their own test when customer contact information or supplier terms appear in the source. Our row-level security guide for AI analytics explains the responsibilities behind these checks.
Evidence: what can an analyst actually verify?
The analyst needs the definition, filter choices, source context, and executed query or equivalent inspectable calculation. An explanation of the agent’s reasoning can be helpful, but it does not replace those artifacts. For the net-sales example, a reviewer should be able to establish which week, refund treatment, and join path produced the number. That review should remain possible after the conversation has been shared.
Record how long that review takes and what help it requires. A platform that produces an answer quickly may still leave an analyst reconstructing the calculation from screenshots. Another may expose a query without making the metric choice clear. Keep those findings separate in the trial notes. They identify different integration or modeling tasks for the team.
Output: what remains after the conversation ends?
A conversation, a dashboard, and a report serve different purposes. An exploratory answer can remain useful as a record of an investigation. A recurring dashboard needs a known refresh path and access policy. A static HTML report needs a generation date, a defined audience, and an owner for regeneration when the underlying rule changes.
Test the deliverable your business users actually intend to keep. Change a date filter, interrupt the query service, and reopen the saved result after a source update. The interface should make it possible to distinguish retained data from a newly executed result. These are operating requirements to evaluate, not capabilities we assume every platform implements in the same way.
Turn the trial into a decision record
Keep a small set of acceptance checks beside the comparison table. Write the expected result before running the question, and record unresolved issues as work items. This avoids turning subjective preferences about interface style into a claim about analytical correctness. It also makes follow-up sessions useful: the team can return to the same task after changing configuration or definitions.
| Trial check | Evidence to keep | Decision it supports |
|---|---|---|
| Metric reconciliation | Approved definition, fixed source data, and expected result | Whether the basic calculation is understood |
| Date and join behavior | Boundary transaction and multi-line/refund cases | Whether the model preserves the intended grain |
| User-specific access | Results from finance and regional identities | Whether the configured query path enforces scope |
| Sharing and export | Recipient test and copy of the generated artifact | Whether distribution matches the intended audience |
| Definition change | Before/after rule and rerun result | Whether the team can maintain shared meaning |
| Investigation quality | Observed contribution, supporting queries, and open hypotheses | Whether a proposed explanation has enough evidence |
Separate a failed configuration from a missing capability. If the wrong connection identity was used, correct the setup and repeat the permission check. If the required output has no supported refresh path, record the engineering work it would require. Neither issue should disappear into a single overall score. Buyers need to know what can be fixed during onboarding and what changes the architecture they are purchasing.
Include total operating effort in the decision. Model authoring, permission setup, reviewing generated work, warehouse compute, AI usage, and supporting recurring outputs can fall under different budgets. Ask for the commercial terms of the exact deployment rather than comparing an introductory seat price with another product’s full service. The trial should help you estimate those responsibilities, even when it cannot predict future usage precisely.
Conclusion
An agentic analytics platform should earn its place by helping your team turn a business question into a checked result that other people can use. Compare the full path: approved meaning, permitted query, inspectable evidence, and maintained output. Choose against the work your team needs to complete, then retain the evaluation cases as the models and workflows evolve.
For a vendor-neutral approach to that path, explore Datus AI/BI or try Datus Studio. Start with an existing business definition and an answer your team can verify. Build the context for that question, then test how another analysis or agent reuses it.
Frequently asked questions
What is the difference between agentic analytics tools and traditional BI?
Agentic analytics adds software that can interpret a request, choose tools, and perform analytical steps in a conversation. Traditional dashboards remain useful for repeated monitoring and shared reporting. Many platforms combine both. Evaluate how the agent uses business definitions and turns exploration into an artifact your team can maintain, rather than treating the presence of a chat interface as the distinction.
Do agentic analytics platforms need a semantic layer?
A reusable semantic layer is valuable when multiple people or interfaces must apply the same metric definition. It can make formulas, dimensions, and query paths inspectable. An agent may also investigate raw data or documents for questions outside that model. The important evaluation is whether it makes the distinction clear and handles unresolved business meaning in a reviewable way.
Does MCP make analytics portable across agents?
MCP provides a way for compatible clients to discover and call tools. The service behind those tools still determines the available definitions, query behavior, and authorization. Two agents connected to one service can select different metrics or filters. Test the same question and identity in each intended client before concluding that the results are consistent.
Can these platforms replace an existing dashboard tool?
It depends on the outputs and operating requirements. A team may retain its dashboard interface and add conversational access to shared definitions. Another may migrate selected workflows to generated dashboards or HTML reports. Compare refresh, access, distribution, and maintenance for each workflow; replacing a presentation does not remove those responsibilities. Our HTML dashboard guide explains the access boundary behind generated interfaces.
Can we compare platforms using accuracy percentages?
Only when the evaluation setup makes the percentages comparable. Use the same questions, data, definitions, identities, and success criteria, and explain how failures are judged. A vendor’s public benchmark or customer statement does not establish performance on your business rules. This guide provides trial tasks and documented capabilities, not measured cross-vendor accuracy scores.
Related articles
- What is agentic analytics? — the category and its connection to business context.
- Data Context Layer: Five Checks Before You Buy — inspecting the definitions and evidence a context service delivers.
- Row-Level Security for AI Analytics — where user-specific access must be enforced.
- HTML Dashboards: Who Owns the Data and Permissions? — evaluating the service behind a generated interface.