
HTML Dashboards: Who Owns the Data and Permissions?
Before replacing a BI interface with an agent-built HTML dashboard, check metric definitions, server-side permissions, refresh behavior, and result validation.
TL;DR
An Agent can replace a dashboard’s presentation without replacing the data platform behind it. Before business users rely on the result, verify its metric definitions, server-side access controls, freshness, and calculations. Datus combines reusable metrics and HTML outputs with server-side SQL Policy: IT defines row filters and column masking, and supported live dashboard queries apply them to the authenticated viewer.
A different interface does not remove the data work
A recent r/PowerBI discussion begins with a familiar tension: business users prefer newly created HTML dashboards, while the author worries about security and maintenance. The post describes one workplace’s experience. It does not demonstrate a security incident or establish that companies generally plan to abandon BI platforms. The original discussion is useful because it exposes the responsibilities behind an attractive interface.
In a specific reply, u/halohunter describes using Claude with existing Power BI semantic models, with each user connecting through their own account. The commenter says their team invested in instructions and Skills covering details such as default date fields, while IT continued to maintain ETL, the warehouse, governance, and semantic models. Their claim that permissions and row-level security hold is an implementation report, not an independent test. The implementation comment illustrates a changing presentation layer over continuing data responsibilities.
An agent-built HTML dashboard is a generated presentation and interaction layer; its data contract and permission boundary depend on the services behind it. The useful evaluation is not whether HTML can display a chart. It is whether the full path from user to query to result remains correct and supportable when the interface changes.
Our AI dashboard article examines how dashboard authoring changes. Here, the question is narrower: what checks must an agent-built dashboard pass before business users can rely on it?
Follow one metric through three users
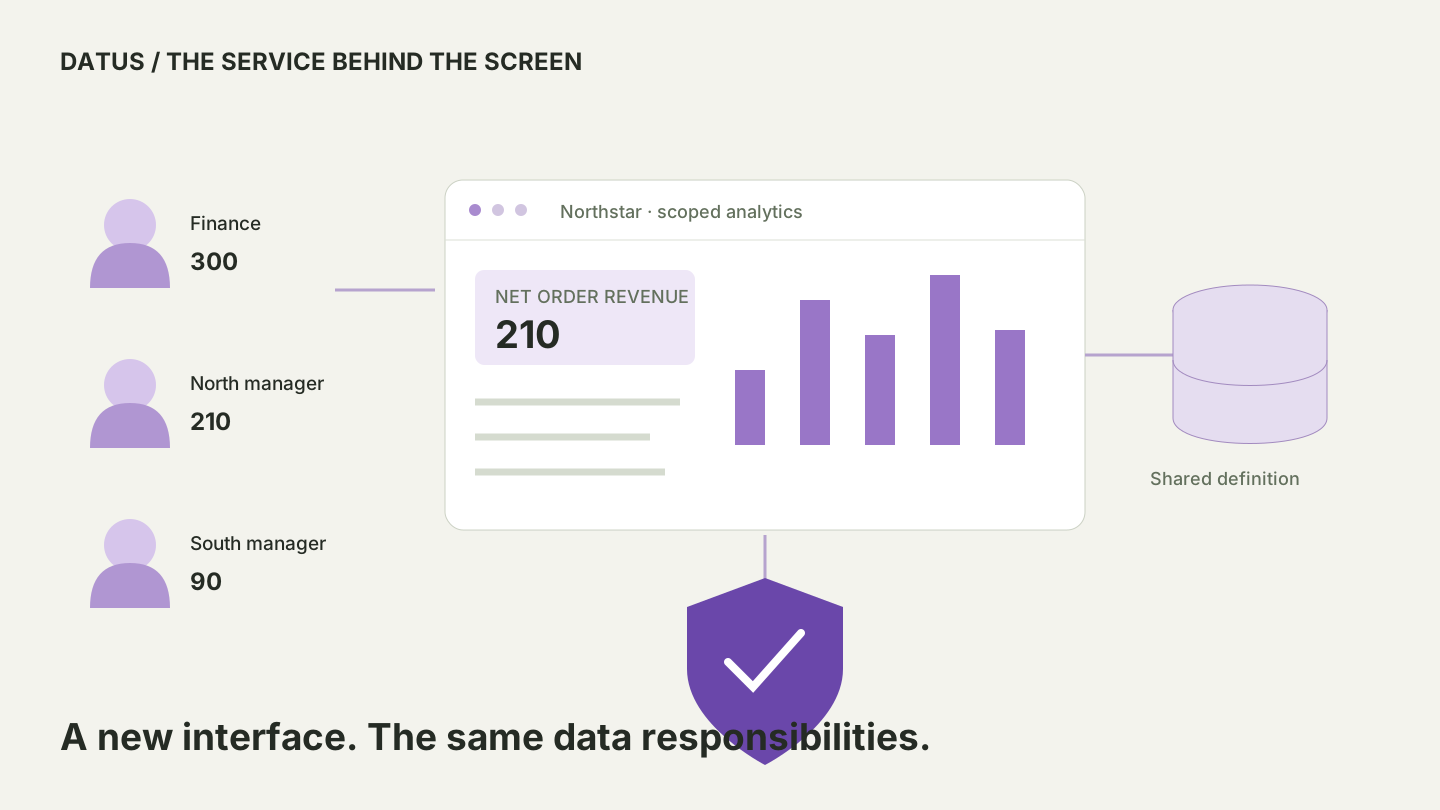
Northstar, a fictional retailer, wants a sales view for Finance and regional managers. Its chosen metric counts completed non-test orders, subtracts refunds, and treats a missing refund as zero. For the October sample, North contributes 210 and South 90, giving Finance a total of 300. These are test figures, not customer results.
The existing SQL-to-metrics example includes the sample data and calculation. A dashboard and an analytical Agent should agree when they query that same definition under the same date range and access scope. Sharing a name such as “net sales” is insufficient if one query includes test orders and the other does not.
| Intended audience | Example permitted scope | Expected October result |
|---|---|---|
| Finance analyst | North and South | 300 |
| North regional manager | North | 210 |
| South regional manager | South | 90 |
This table defines a proposed access policy; it does not prove any runtime enforces it. A useful test tries to obtain South’s rows as the North manager through the query endpoint, exports, and alternate filters. The expected outcome is that unauthorized data never reaches that user’s browser. Hiding a region selector while sending every region’s data to the page does not implement that policy.
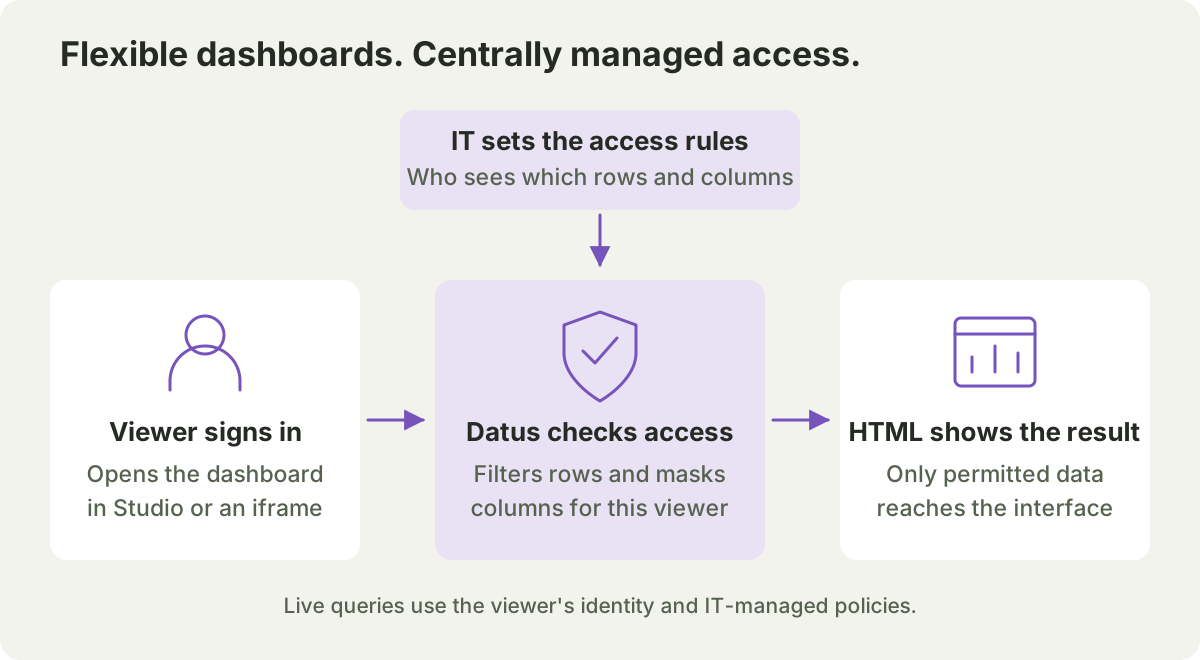
IT sets the access rules once. When someone opens a live dashboard in Studio or an iframe, Datus checks who they are and applies the configured row filters and column masking before returning data. Business users can change the layout while the same central access rules govern its queries. Static reports already contain a copy of the data, so their sharing permissions need separate control.
View the access-control diagram at full size
Four checks before the dashboard becomes a business tool
Check the metric contract, not just the chart
A metric contract makes the calculation’s scope explicit: definition, source, time basis, permitted dimensions, and the treatment of exclusions and refunds. Northstar should retain the named metric and model version with its query. The chart title and default date range should accurately describe the result it displays. A beautiful month-to-date chart using an order-created date can still answer a different question from a Finance report based on payment dates.
Validation should compare the grouped values and totals with a trusted reference. Include an excluded order, a refund, an empty group, and the time boundary in the test data. The business-rule validation guide explains why executing valid SQL and representing an accepted business rule are separate checks.
Check the server’s decision for each reader
The server should decide whether the caller can view the artifact and query the relevant data. A page’s filter parameter is a request, not proof of permission. Decide how application identity maps to warehouse credentials or another enforced data policy, especially if the backend uses a shared service account. A logged-in viewer does not automatically mean their personal warehouse restrictions carry through.
Test direct requests as a restricted user, not only the happy path as an administrator. Check denied regions, detail rows, downloads, shared links, and access after a grant is removed. The row-level security article covers the distinction between access to a resource and access to rows. HTML generation itself provides neither boundary.
Check whether the page is a snapshot or a live query
A static report can contain a fixed copy of the result. Changing a chart or sorting that embedded data does not make it fresh. Its owner should record the source period and generation time, control who receives the file, and decide when to rebuild it. Once a permitted recipient has a downloaded snapshot, revoking their application access does not retrieve that copy.
A live dashboard needs a working query service and an explicit refresh policy. Test an upstream load delay and a backend failure. The page should distinguish a newly returned result from an old result retained on screen. Keep the latest warehouse load, query execution time, and report generation time separate: they answer different freshness questions.
Check ownership after the first successful demo
Assign owners to the calculation, data pipeline, access policy, and generated artifact. They may be different people. When Northstar changes its refund treatment, someone must check which dashboards use the metric and which contain copied SQL. An exported HTML file does not acquire a maintenance owner simply because an Agent created it.
Retain the definition and query evidence needed to investigate a result. Plan a regression check for metric edits, schema changes, and default filters. Our data lineage guide explains how source dependencies and execution context support that review.
How Datus fits behind an HTML interface
Datus combines data engineering Agent workflows with reusable semantic definitions and the DOSI engine. In Datus Studio, teams can work with models and generated analytical outputs while their supported warehouse remains the query backend. The AI/BI solution shows the different output forms. The practical value is that an interface can change without requiring every chart or Agent to invent a new business formula.
Reuse the definition, then inspect the output’s query path
Datus’s semantic modeling workflow can build or revise metrics from existing SQL and relevant context, validate the model, and compare outputs with reference SQL. Northstar can use that workflow to represent its completed-order and refund rules. AskMetrics retrieves existing metric definitions before querying them. These steps support consistent calculation; the team still needs to review the definition and access scope.
The generated artifact’s actual query path also matters. The documented HTML dashboard workflow can start from metrics or supplied SQL and build parameterized query templates. A copied template can become another calculation artifact to maintain; its origin in a metric does not establish that later model edits automatically update it. Inspect what the published dashboard runs and include it in change checks.
Choose the HTML delivery form deliberately
The HTML report workflow embeds results into a generated page for a report-style deliverable. Treat the embedded data as a snapshot with a defined audience and regeneration process. Its distribution permissions are part of the data decision, even when the recipient needs no live database connection.
The HTML dashboard workflow describes filter-driven queries through a backend. A standalone HTML file is not the whole service: query execution, connectivity, authorization, and maintenance must be present in the deployed environment. The local Agent workflow and hosted Studio are different execution surfaces, so validate the one the team plans to use.
Let IT govern the data while business users build the interface
Datus already implements this separation through SQL Policy row filters and column masking. Project owners and admins can centrally configure these policies for selected data sources and tables. Row filters use security-marked user attributes to restrict the records a caller can read. Column masking can redact emails, retain trailing characters, or return NULL, with profiles applied to everyone or selected by a security attribute.
For Northstar, IT could configure a region policy that gives the North manager access to North orders and the South manager access to South orders. A separate masking policy could protect customer contact details. Business users can then generate the HTML layout around the governed query path; they do not need to recreate those restrictions in every chart. The access matrix above supplies expected results for testing this configuration, rather than reporting a live deployment test.
The enforcement happens behind the page. For authenticated live dashboard queries, the backend identifies the viewer and loads that user’s security attributes to construct a trusted policy context. It does not accept a browser-supplied region as proof of access. The Agent runtime uses that context for supported SQL reads and metric queries; metric execution goes through policy-aware compilation and SQL execution. The model does not have to remember to add a security condition to every generated query.
Row filters operate on original physical-table values. Column masking follows, before business filters, joins, and aggregation. This protects the query path rather than merely changing text in the rendered HTML. It also means masking a column used in a calculation can change the result, so teams should validate the policy and metric together. Missing required security attributes or an unmapped attribute-based masking profile cause the read to be denied.
Carry the viewer’s identity through an embedded dashboard
Embedding a published dashboard in an iframe changes where the interface appears; the authenticated viewer still determines the live query’s policy scope. Datus checks access to the dashboard separately from data permissions, and its embedded login flow establishes the user’s session. The iframe itself is not the security control, and a parent page’s filters do not grant additional data access.
This gives IT a central permission boundary while business users create different interfaces over it. The same configured policies can govern supported SQL and metric reads without making the generated HTML responsible for deciding who can see North or South. Teams should still test direct requests, detail views, and exports as each intended role. This is Datus’s policy enforcement, not a claim that it automatically imports another BI platform’s RLS rules.
Distinguish a protected live view from a published snapshot
Datus blocks anonymous dashboard and Subagent links when row filters or column masking are enabled, because an anonymous visitor has no identity against which to evaluate those policies. Authenticated published dashboards query live data under the viewer’s identity. Publishing an artifact does not freeze or bypass that viewer’s data permissions.
A published report body is different: it contains a precomputed snapshot. Readers see the data already published in that body, rather than a new per-viewer filtered result. IT must therefore govern the snapshot’s audience and distribution as well as the query that created it. Keep protected live queries on the supported Datus path; a static export or an external tool that queries the database independently needs its own access controls.
Avoid rebuilding context for every new interface
The same maintenance question applies when another chatbot joins the stack. Keep the shared metric definition, source mappings, and accepted conventions outside an individual conversation wherever the architecture permits. Client instructions can explain how to find and use that definition; they should not quietly become the only record of the formula. An HTML report, a fixed dashboard, and an Agent can then refer to the same business contract, even when they present different slices of it.
That goal still needs a change process. After a rule update, identify every consuming artifact, compare the new result with the intended reference, and check what requires rebuilding or republishing. Shared definitions reduce duplicated logic; they do not eliminate the need to track copied SQL, snapshots, and client-specific behavior. This is the concrete maintenance problem behind calls for reusable business context.
Conclusion
An HTML interface can be a useful way to deliver analytics. The data team still owns the work that makes its answers usable: definitions, ingestion, access, freshness, and validation. Before expanding Northstar’s prototype, run the same metric through Finance and restricted regional views, inspect the data returned to each, and verify the refresh and failure behavior. Judge the service behind the page as carefully as the page itself.
Frequently asked questions
Can an HTML dashboard replace a BI report?
It can replace some presentation and interaction workflows, depending on the requirements. Metric definitions, query execution, access controls, refresh behavior, and operational ownership still need a home. Evaluate those responsibilities rather than treating the file format as a complete BI platform.
Does hiding dashboard filters enforce row-level security?
No. A hidden filter does not prevent direct requests or exposure through data already sent to the browser. Enforce the intended access scope on the server or data platform, then test unauthorized queries, details, and exports with a restricted identity.
How does Datus control access to an embedded HTML dashboard?
For authenticated live dashboard queries, Datus identifies the viewer, loads server-managed security attributes, and applies configured SQL Policy row filters and column masking to supported query paths. IT manages those policies centrally. An iframe presents the interface; it does not replace authentication or query enforcement. A precomputed report snapshot needs separate distribution controls.
Can the same metric serve a dashboard and an Agent?
Yes, when both use the intended definition and compatible query scope. Inspect the actual query path: a copied SQL template or a snapshot may need separate updates when the metric changes. Shared naming alone does not establish consistent computation.
Does an HTML report refresh automatically?
Not necessarily. A snapshot retains the data embedded when it was generated. A live dashboard needs a backend and a refresh mechanism. Label the relevant times and test what the reader sees when a refresh fails or the source load is delayed.